
Kobo Works is a service that provides usable screens, models, and systems for on-site and management decision-making—such as production planning, inventory, process improvement, demand forecasting, and measure comparison.
Rather than just system development, we combine visualization of existing data, modeling of business challenges, simulation, mathematical optimization, AI prediction, dashboards, and business app development to build a system that enables companies to make more rational decisions on a daily basis.
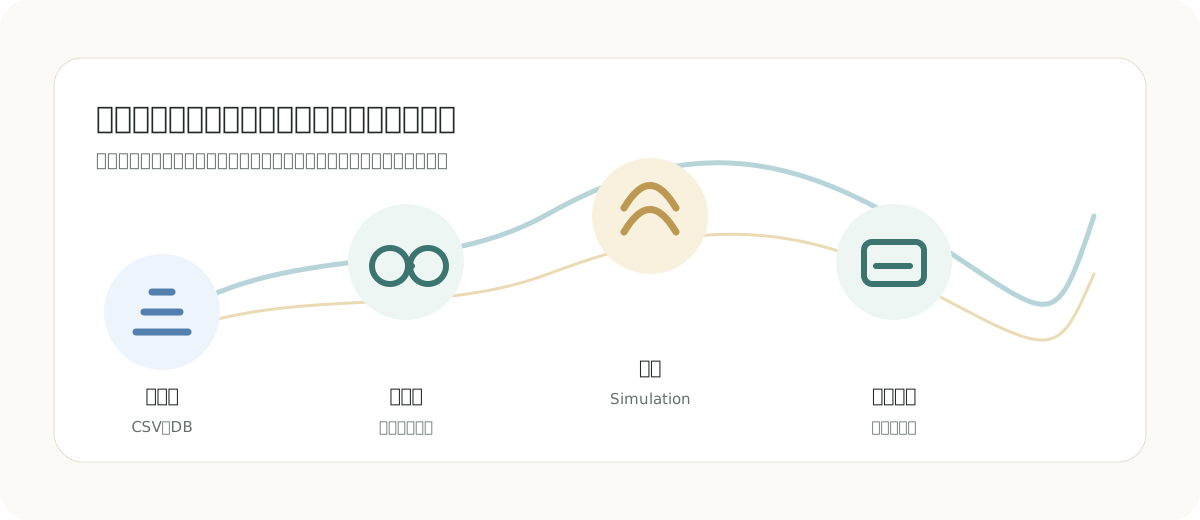
What is Kobo Works?
| item | Contents |
|---|---|
| Decision Support System | We incorporate manufacturing DI into screens, models, and operations that can be used in business operations. |
| Common modules + custom implementation | Tailor demand forecasting, inventory, optimization, dashboards, and more to each company’s operations. |
| Start small | Instead of making it a large-scale system from the start, we gradually scale from PoC or prototypes. |
| Reflecting on-site constraints | Practical constraints such as delivery times, equipment, personnel, inventory, and quality are reflected in models and screens. |
| Emphasize continued use | We design including post-implementation operations, improvement cycles, and update procedures. |
Challenges that can be solved
- Production plans are created solely through experience and intuition.
- Want to reduce inventory but fear of stockouts
- It is difficult to decide which measures to choose in response to fluctuations in demand.
- Bottlenecks in the process are hard to see
- Want to verify the effects of capital investment and personnel allocation in advance
- Operations are dependent on Excel and personalized tools.
- Data exists but cannot be used for decision-making
- We want to create screens and systems that are practical, not just PoCs.
- Want to incorporate simulation and optimization into your business operations
Let’s start with the PoC.
At Kobo Works, instead of building a large-scale system from the start, we first conduct PoC for a single decision-making task. We verify effectiveness with actual data to determine whether it can be used on-site and whether it is worth moving forward to full implementation.
PoC Menu
| Menu | Confirmation by PoC | Main Deliverables |
|---|---|---|
| Production planning and allocation optimization | Can you create a feasible plan based on constraints such as deadlines, capabilities, arrangements, and personnel? | Optimization models, planning proposals, comparison screens |
| Business Simulation | Can we reproduce the current state of processes, queues, and inventory, and compare the effectiveness of improvement measures? | Simulation models, measure comparisons, and analysis reports |
| Demand forecasting and inventory assessment | Not only forecasting accuracy, but also whether it can be used to make decisions including stockout risks and inventory costs. | Forecast model, evaluation results, production and inventory judgment screen |
| Delivery and Shift Optimization | Can you create an action plan that reflects delivery conditions, load capacity, desired days off, skills, and so on? | Optimization model, route and shift proposals, comparison screens |
| Prototyping decision-making apps | Can Excel and existing calculation logic be turned into business interfaces that can be used continuously? | Web prototypes, operation flows, and data integration proposals |
At the start of the PoC, agree on what you want to decide, the data to be used, site constraints, and evaluation metrics. At the end, not only models and prototypes but also verification results and the requirements required for full implementation are organized and shared.
How to implement it
| What can be introduced | Contents |
|---|---|
| Analytics dashboard | Visualize KPIs, processes, inventory, quality, demand, and more. |
| Simulation app | Measures such as inventory, processes, personnel allocation, and capital investment are compared. |
| Mathematical Optimization App | We assist with production planning, allocation, scheduling, and inventory optimization. |
| Demand Forecasting Model | Forecasts demand, shipments, sales volumes, and more. |
| Anomaly Detection Model | Detect anomalies in equipment data, quality data, and process data. |
| Decision Support Screen | We compare multiple options, assess risks, and review recommended proposals. |
| Data Processing Infrastructure | We will establish CSV, DB, cloud, API integration, and periodic processing. |
| prototype | Create simple apps and demo screens for PoCs. |
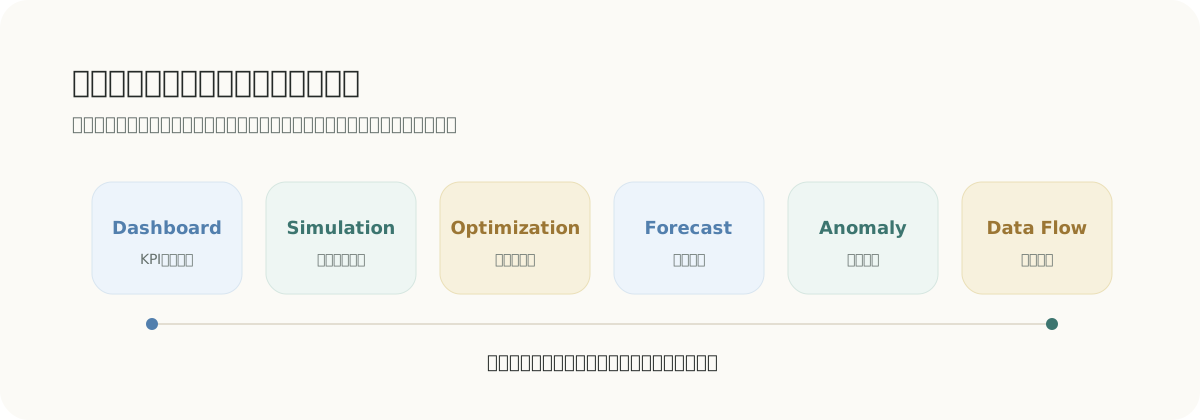
You can specifically check the prototype images created in PoC through six demos. Please watch the actual screen as you change the conditions, compare calculation results, and choose the plan to execute.
INTERACTIVE DECISION DEMOS
Decision support on a real screen.
Enter the conditions, compare the results, and select the plan to execute.Kobo Worksaims to create a "business app that goes beyond just analysis,"6You can experience it in a demonstration.
DEMO 01
Production Planning Optimization
Reflect constraints such as delivery dates, equipment shutdowns, personnel, and outsourcing, and compare multiple proposals using the same indicators. Review the reasons for the recommendation and approve the implementation plan.
- Compare delivery times, overtime, and costs
- Concrete action on site
DEMO 02
Production Line Simulator
Reproduce process variations and equipment failures to identify bottlenecks. We compare the effects and costs of support placement, buffer expansion, and equipment parallelization.
- Evaluating production volume and achievement probability
- Turning Improvement Measures into On-Site Actions
DEMO 03
Demand forecasting
Visualizes not only median demand but also forecast intervals. Compare stockout risk and inventory costs to determine weekly production volume, safety stock, and switching conditions.
- Reflecting Forecast Errors in Inventory
- Clearly state the conditions for rejudgment
DEMO 04
queue simulator
Imagining factories, hospitals, call centers, and supermarkets,M/M/1, M/M/c, prioritize, and batch processing selection. Waiting time andSLAWe will improve them.
- Reproducing Variation in Congestion
- SLA/Compare measures by cost
DEMO 05
Delivery Optimization
Set delivery destinations, demand, vehicles, and load capacity on the map. Routes and visit order are compared in terms of total distance, vehicle load, and number of vehicles used.
- Check the route on the map
- Create an execution plan for each vehicle
DEMO 06
Shift optimization
Considered all desired days off, skills, required number of workers, and working hours simultaneously. Choose store hiring proposals from shift options with different fulfillment rates, fairness, and labor costs.
- Restricted Leave Days and Skills
- Comparing fairness and labor costs
Module Examples
- Demand Forecasting Module
- Inventory Simulation Module
- Production Planning Optimization Module
- Process Bottleneck Analysis Module
- Quality Data Analysis Module
- Equipment Utilization Analysis Module
- Measure Comparison Simulation Module
- KPI Dashboard Module
- Automatic report generation module
- Analysis Support Module Using Generative AI
We select and combine the necessary modules to meet each company’s challenges. For example, you can first try only inventory simulation, then combine demand forecasting with dashboards.
Support Examples and Use Cases
Inventory Simulation App
Challenge: Unable to determine how much inventory should be held in response to demand fluctuations.
Implementation details: Based on past shipment data, we analyze demand fluctuations and build simulation screens that can compare inventory levels and out-of-stock risks.
Deliverables: Inventory simulation model, visualization dashboard, measure comparison screen.
Production Planning Optimization App
Challenge: Production planning depends on the experience of the person in charge and takes time to create the plan.
Implementation details: Organize production capacity, delivery dates, items, arrangements, constraints, and build a mathematical optimization model. We will create a screen that allows you to compare proposals based on multiple conditions.
Deliverables: Optimization model, plan comparison screen, Python code, business usage documentation.
Process Bottleneck Visualization
Challenge: It is difficult to identify which processes are constraining production capacity.
Implementation: Build a dashboard that visualizes processing time, wait times, and uptime by process to identify potential bottlenecks.
Deliverables: Process analysis dashboard, bottleneck analysis report, and comparison materials for improvement measures.
From PoC to Full Implementation
1. Decide on a PoC Theme
Review current issues, business workflows, and usage data, and decide on the decisions and evaluation indicators to verify through PoC.
2. Prototype the model and screen
Using real data, we create screens that compare results with models such as predictions, simulations, and optimizations.
3. Evaluate on Site
Verify results in field cases and evaluate accuracy, effectiveness, and ease of use. Whether to proceed with full implementation will also be decided based on these results.
4. Implementation and Operational Design
If effectiveness is confirmed through the PoC, data integration, permissions, operational methods, and update procedures will be established to ensure continuous practical use.
5. Continuous Improvement
As needed, we provide ongoing support through feature additions, Kobo advisory, Kobo training, and Kobo consulting.
Examples of deliverables
- Application
- Model Detailed Report
- PoC Report
- operation manual
- Operation Design Document
- Presentation materials for management
In particular, we emphasize screens usable for decision-making, simulations that allow for measure comparison, optimization models that reflect on-site constraints, and prototypes that can be continuously used in business operations.
Suitable Consultations
We propose the introduction of Kobo Works for companies that want to leverage data analysis, simulation, mathematical optimization, and AI in their business decision-making.
You can start with small PoCs or prototypes and gradually develop them into practical forms suitable for use on site. If you have any difficulties with production planning, inventory, process improvement, demand forecasting, or policy comparison, please feel free to consult us.