
100 Exercises / System Development / 100 Exercise on System Development
Introduction to React for Manufacturing | 10 Key Steps to Learn Lists, Forms, and API Integration with Practical Data
Designing Business Screens That Don’t Stop Manufacturing Floor Decisions — 10 Practical Tips for React Frontend
Using Work Instructions and Quality Assurance App for manufacturing sites as a subject, we will continuously organize everything from React’s basic configuration to component design, lists, details, input forms, API integration, search, and loading error display. The goal is not simply to create screens, but for workers, team leaders, and quality assurance staff to make decisions without hesitation about “what to do next.”
In this article, instead of using external data, we use fictional manufacturing data generated in Python to visualize the number of cases, input error rates, API response times, and task completion rates related to screen design.
[!NOTE] This material is a notebook previously used by Surikoubo (or personally by the representative, Kazuyama), and has been reconstructed, edited, and published with the company’s permission.
All data listed is fictional and has no relation whatsoever to real companies, factories, or figures.
Introduction: Practical Challenges in Manufacturing Covered in This Article
The business interface on the manufacturing floor differs from typical information viewing sites. Users may operate tablets while wearing gloves, and even a few seconds of hesitation during equipment shutdowns or quality abnormalities can lead to losses. Furthermore, the information displayed on the screen spans multiple operational data points such as work instructions, equipment, part numbers, quality judgments, and contact personnel.
The practical challenges this time are the following three points.
- Being able to quickly find high-priority work instructions
- Preventing omissions or inconsistencies in performance entries before registration
- Even if there are API delays or failures, users can understand the situation and their next actions.
React is a library that divides the screen into parts and updates the display according to state changes. However, simply adopting React does not necessarily make it an easy-to-use business system. Component boundaries, states,API/Linking experiences during exceptions to work rules is important.
Common situations on site
- Continuously adding columns to the list results in important anomalies and delivery delays being buried
- The status display rules differ between the list and the details, leaving users confused about how to judge.
- After sending input values, the server returns an error and re-enters
- During API communication, the screen appears unresponsive, and users repeatedly press buttons.
- Only “Error has occurred” is displayed, and I am unsure whether to try again or contact the responsible department.
These are not just issues of appearance. Delays in response, incorrect inputs, double registrations, and increased inquiries affect delivery times, quality, and utilization rates.
Why is this issue so difficult to judge?
You can’t judge the quality of a screen by display speed alone. For example, reducing columns improves the overall visibility, but it may lead to a lack of decision-making materials. Strict input checks improve quality, but if exceptions are not tolerated on site, operations come to a halt.
Therefore, technical indicators are linked with operational metrics.
| Design Targets | Technical Specifications | business indicator |
|---|---|---|
| List & Search | Number of displayed items, number of filtered items | Time to find the target and missed rates |
| input form | Number of error items, number of re-entries | Registration completion rate, input time |
| API integration | Response time and failure rate | Wait time, double operation rate |
| status display | Identifying Loading Errors | Attainment and Inquiry Rates |
Overview of Exercise covered this time
| No. | Theme | Key Points to Check in the Factory Work Instruction App |
|---|---|---|
| 041 | Basic Structure of React | Division of roles for screen, status, and processing |
| 042 | Screen Components | Reuse Units and Scope of Change Influence |
| 043 | List Screen | Overview of priority tasks |
| 044 | Detailed screen | Rationale and history of one case |
| 045 | input form | Input fields and initial values |
| 046 | validation | Pre-registration detection of inconsistencies |
| 047 | API Calls | Response Time and Failure Rate |
| 048 | Response display | Conversion from API Data to Display Items |
| 049 | Search & Filter | Detection of abnormal or delayed targets |
| 050 | Loading error | Guidance on standby, retry, and contact |
Through these 10 steps, we create a flow of responsibilities called App → Page → Business Components → API and finally review operational KPIs.
Preparing the Python environment
pandas handles tabular data, numpy generates random numbers, and matplotlib visualizes them. Japanese uses japanize_matplotlib for label display. Fix the random seed so that rerunning results will yield the same result.
%matplotlib inline
%config InlineBackend.figure_format = 'svg'

import sys
import numpy as np
import pandas as pd
import matplotlib
import matplotlib.pyplot as plt
import japanize_matplotlib
from IPython.display import display

SEED = 20260711
rng = np.random.default_rng(SEED)

print(f"Python     : {sys.version.split()[0]}")
print(f"numpy      : {np.__version__}")
print(f"pandas     : {pd.__version__}")
print(f"matplotlib : {matplotlib.__version__}")
print(f"random seed: {SEED}")
Python : 3.13.1
numpy : 2.5.1
pandas : 3.0.3
matplotlib : 3.11.0
random seed: 20260711Creation of Fictional Data
We will prepare 360 work instructions issued across three production lines. Each record has a scheduled date and time, item number, quantity, progress, priority, defect rate, and equipment condition. Additionally, it generates 800 API access entries and 320 performance entries.
At the time of data generation, intentionally include equipment with abnormal shutdowns, overdue deliveries, and inconsistencies in input values. This is to confirm whether the screen can handle not only normal systems but also situations that require on-site judgment.
n_orders = 360
base_time = pd.Timestamp("2026-06-01 08:00")

orders = pd.DataFrame({
    "order_id": [f"WO-{i:04d}" for i in range(1, n_orders + 1)],
    "line": rng.choice(["No.1Line", "No.2Line", "No.3Line"], n_orders, p=[0.38, 0.34, 0.28]),
    "product": rng.choice(["AX-100", "AX-200", "BZ-110", "CZ-300"], n_orders),
    "planned_at": base_time + pd.to_timedelta(rng.integers(0, 30 * 24, n_orders), unit="h"),
    "planned_qty": rng.integers(80, 501, n_orders),
    "progress_pct": np.clip(rng.normal(72, 28, n_orders), 0, 100).round(0),
    "priority": rng.choice(["high", "middle", "low"], n_orders, p=[0.18, 0.52, 0.30]),
    "defect_rate_pct": np.clip(rng.gamma(1.6, 0.55, n_orders), 0, 5).round(2),
    "machine_status": rng.choice(["operation", "Stage selection", "inspection", "abnormal stop"], n_orders, p=[0.70, 0.13, 0.11, 0.06]),
})
orders["status"] = np.select(
    [orders["progress_pct"].eq(100), orders["progress_pct"].gt(0)],
    ["Finished", "in progress"],
    default="not yet started",
)
snapshot_at = pd.Timestamp("2026-06-22 08:00")
orders["overdue"] = (orders["planned_at"] < snapshot_at) & (orders["status"] != "Finished")
orders["needs_attention"] = (
    orders["overdue"]
    | (orders["defect_rate_pct"] >= 1.5)
    | orders["machine_status"].eq("abnormal stop")
)

n_api = 800
api_logs = pd.DataFrame({
    "endpoint": rng.choice(["GET /orders", "GET /orders/:id", "POST /results"], n_api, p=[0.48, 0.32, 0.20]),
    "latency_ms": np.clip(rng.lognormal(np.log(420), 0.62, n_api), 80, 5000).round(0),
})
api_logs["failed"] = rng.random(n_api) < np.where(api_logs["latency_ms"] > 1500, 0.16, 0.025)

n_forms = 320
forms = pd.DataFrame({
    "good_qty": rng.integers(60, 481, n_forms),
    "defect_qty": rng.integers(0, 18, n_forms),
    "planned_qty": rng.integers(80, 501, n_forms),
    "temperature_c": rng.normal(182, 9, n_forms).round(1),
    "operator_entered": rng.random(n_forms) > 0.035,
    "reason_entered": rng.random(n_forms) > 0.42,
})
forms.loc[rng.choice(n_forms, 18, replace=False), "good_qty"] *= -1
forms["qty_invalid"] = (forms["good_qty"] < 0) | ((forms["good_qty"] + forms["defect_qty"]) > forms["planned_qty"])
forms["temperature_invalid"] = ~forms["temperature_c"].between(165, 200)
forms["reason_invalid"] = (forms["defect_qty"] >= 10) & ~forms["reason_entered"]
forms["operator_invalid"] = ~forms["operator_entered"]
forms["is_valid"] = ~forms[["qty_invalid", "temperature_invalid", "reason_invalid", "operator_invalid"]].any(axis=1)

print(f"work instruction: {len(orders):,}records / Note: {orders['needs_attention'].sum():,}records")
print(f"APILog: {len(api_logs):,}records / failure: {api_logs['failed'].sum():,}records")
print(f"Record Entry: {len(forms):,}records / Input inconsistencies present: {(~forms['is_valid']).sum():,}records")
display(orders.head(5))
Work instructions: 360 items / Items to note: 226 items
API logs: 800 / Failures: 23
Actual entries: 320 entries / Entries with input inconsistencies: 209 entries| order_id | line | product | planned_at | planned_qty | progress_pct | priority | defect_rate_pct | machine_status | status | overdue | needs_attention | |
|---|---|---|---|---|---|---|---|---|---|---|---|---|
| 0 | WO-0001 | No.1Line | CZ-300 | 2026-06-13 04:00:00 | 239 | 73.0 | middle | 0.23 | operation | in progress | True | True |
| 1 | WO-0002 | No.3Line | BZ-110 | 2026-06-10 13:00:00 | 155 | 56.0 | low | 0.33 | operation | in progress | True | True |
| 2 | WO-0003 | No.2Line | CZ-300 | 2026-06-12 20:00:00 | 470 | 60.0 | middle | 0.55 | operation | in progress | True | True |
| 3 | WO-0004 | No.2Line | BZ-110 | 2026-06-08 07:00:00 | 415 | 19.0 | middle | 1.94 | operation | in progress | True | True |
| 4 | WO-0005 | No.3Line | CZ-300 | 2026-06-09 11:00:00 | 137 | 78.0 | middle | 0.57 | operation | in progress | True | True |
No.041: Understanding the Basic Structure of React
Meaning in Practice
In React, the screen is divided into components and changes in state caused by data and user actions are reflected in the display. In manufacturing operations, we handle states with varying frequency and impact ranges, such as search conditions, selected work instructions, data entry performance, and API communication status.
By gathering all states into the top-level App, even small input changes can re-evaluate a wide area, making it harder to track the impact of modifications. Only states shared across multiple screens are placed at the top, while local states such as values in the middle of input are placed near the screen you are using is the basic method.
Approach to Analysis and Modeling
If the frequency of state changes is and the number of affected components is , a simple load indicator for design comparison can be set to
You can place it like that. This is not measured performance, but rather an indicator used to compare update ripple effects and maintenance impact. Compare placing states in the appropriate hierarchy with placing them all in App.
In React, the screen-specific state is placed near the usage area.
function OrderListPage() {
  const [filters, setFilters] = useState({ line: "all", attentionOnly: false });
  const [selectedOrderId, setSelectedOrderId] = useState(null);
  return <OrderTable filters={filters} onSelect={setSelectedOrderId} />;
}
Check with Python
state_design = pd.DataFrame({
    "Condition": ["Login Users", "Search Criteria", "Instructions for selection", "Actual input values", "APIcommunication status"],
    "Number of changes/time": [1, 24, 18, 120, 54],
    "Number of Effects of Proper Placement": [8, 3, 3, 2, 2],
    "everythingAppNumber of placement influences": [8, 8, 8, 8, 8],
})
state_design["Properly Placed Load"] = state_design["Number of changes/time"] * state_design["Number of Effects of Proper Placement"]
state_design["AppConcentration load"] = state_design["Number of changes/time"] * state_design["everythingAppNumber of placement influences"]
display(state_design)

load = state_design[["Properly Placed Load", "AppConcentration load"]].sum()
ax = load.plot(kind="bar", color=["#2E86AB", "#D1495B"], figsize=(7, 4))
ax.set_title("Comparison of Update Ripple Load by State Placement")
ax.set_xlabel("Designing condition management")
ax.set_ylabel("Load Score for Comparative Use")
ax.grid(axis="y", alpha=0.3)
plt.xticks(rotation=0)
plt.tight_layout()
plt.show()
print(f"Load reduction rate through proper placement: {1 - load.iloc[0] / load.iloc[1]:.1%}")| Condition | Number of changes/time | Number of Effects of Proper Placement | everythingAppNumber of placement influences | Properly Placed Load | AppConcentration load | |
|---|---|---|---|---|---|---|
| 0 | Login Users | 1 | 8 | 8 | 8 | 8 |
| 1 | Search Criteria | 24 | 3 | 8 | 72 | 192 |
| 2 | Instructions for selection | 18 | 3 | 8 | 54 | 144 |
| 3 | Actual input values | 120 | 2 | 8 | 240 | 960 |
| 4 | APIcommunication status | 54 | 2 | 8 | 108 | 432 |
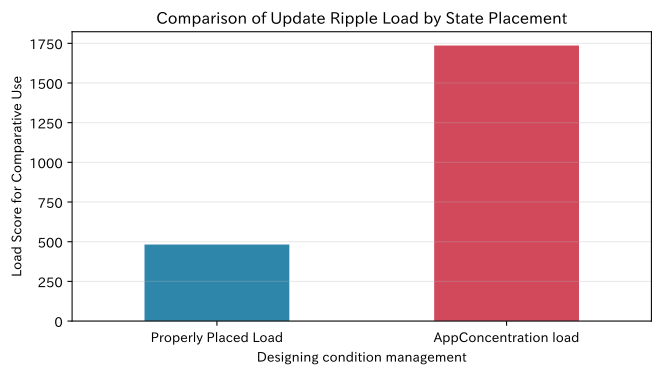
Load reduction rate with proper placement: 72.2%Reading the results
The more frequently changing states such as input values or communication status, the greater the effect of locking them within the necessary range. In practice, design decisions are made not based solely on load scores; instead, the need to share values across multiple screens, whether to retain them after browser updates, and whether to keep them in audit logs is also considered.
No.042: Creating Screen Components
Meaning in Practice
By dividing the business screen into StatusBadge, OrderTable, OrderDetail, ResultForm, etc., you can unify status colors and display formats. On the other hand, if you break it down too finely, data transfers increase, making it harder to track the changes made.
Approach to Analysis and Modeling
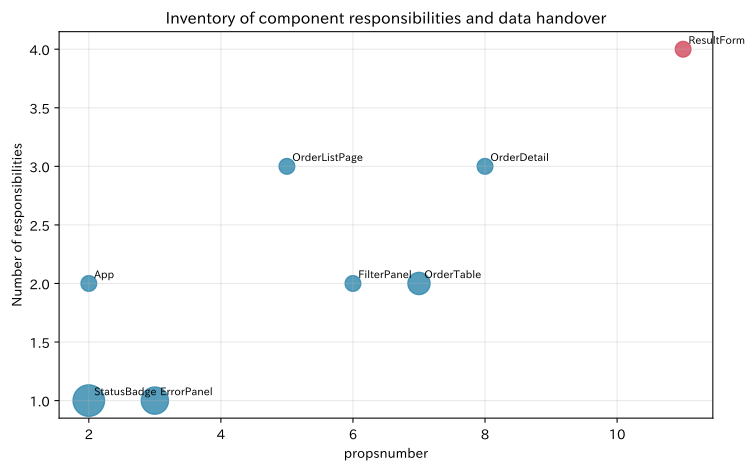
Component candidates are evaluated by Is there a single business responsibility, whether it can be reused across multiple screens, or can it be tested independently?. Here, we inventory the number of responsibilities, number of screens used, and the number of received values (props), and select parts with a large number of responsibilities or props as candidates for splitting.
function StatusBadge({ status }) {
  const label = { running: "Operation", stopped: "Abnormal stop" }[status] ?? "Not confirmed";
  return <span className={`status status--${status}`}>{label}</span>;
}
Check with Python
components = pd.DataFrame({
    "component": ["App", "OrderListPage", "FilterPanel", "OrderTable", "StatusBadge", "OrderDetail", "ResultForm", "ErrorPanel"],
    "Number of responsibilities": [2, 3, 2, 2, 1, 3, 4, 1],
    "Number of screens used": [1, 1, 1, 2, 4, 1, 1, 3],
    "propsnumber": [2, 5, 6, 7, 2, 8, 11, 3],
})
components["Split Review"] = (components["Number of responsibilities"] >= 4) | (components["propsnumber"] >= 10)
display(components)

fig, ax = plt.subplots(figsize=(8, 5))
colors = np.where(components["Split Review"], "#D1495B", "#2E86AB")
ax.scatter(components["propsnumber"], components["Number of responsibilities"], s=components["Number of screens used"] * 140, c=colors, alpha=0.8)
for _, row in components.iterrows():
    ax.annotate(row["component"], (row["propsnumber"], row["Number of responsibilities"]), xytext=(4, 4), textcoords="offset points", fontsize=8)
ax.set_title("Inventory of component responsibilities and data handover")
ax.set_xlabel("propsnumber")
ax.set_ylabel("Number of responsibilities")
ax.grid(alpha=0.3)
plt.tight_layout()
plt.show()| component | Number of responsibilities | Number of screens used | propsnumber | Split Review | |
|---|---|---|---|---|---|
| 0 | App | 2 | 1 | 2 | False |
| 1 | OrderListPage | 3 | 1 | 5 | False |
| 2 | FilterPanel | 2 | 1 | 6 | False |
| 3 | OrderTable | 2 | 2 | 7 | False |
| 4 | StatusBadge | 1 | 4 | 2 | False |
| 5 | OrderDetail | 3 | 1 | 8 | False |
| 6 | ResultForm | 4 | 1 | 11 | True |
| 7 | ErrorPanel | 1 | 3 | 3 | False |
Reading the results
ResultForm is a review candidate with both a large number of responsibilities and props, divided into input fields, verification messages, and send operations. On the other hand, it’s worth keeping StatusBadge for multi-screen use kept small. This table is not for mechanical pass/fail judgments, but is used as material in design reviews to explain “why this boundary is used.”
No.043: Creating a List Screen
Meaning in Practice
The purpose of the list screen is not to show all the data, but to allow the person in charge to decide the order in which they should respond. The work order list allows you to check lines, scheduled dates and times, progress, priority, equipment status, and critical attention judgments on the first screen.
Approach to Analysis and Modeling
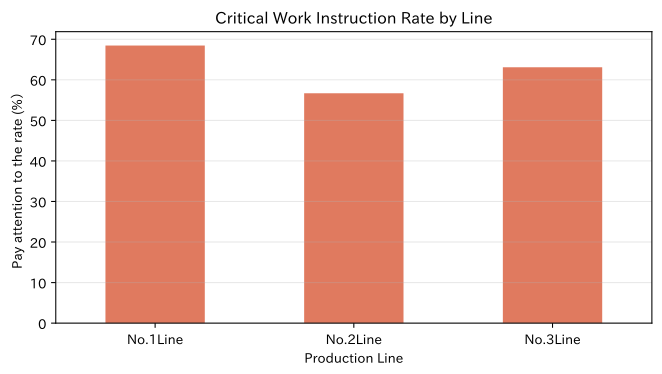
Using the aggregation unit of the list as the line, the number of instructions, cases requiring attention, number of abnormal stops, and average progress are calculated as KPIs. The caution rate is
That’s right. By listing not only the number of cases but also the denominator, you can compare lines of different sizes.
function OrderTable({ orders, onSelect }) {
  return <table><tbody>{orders.map(order => (
    <tr key={order.orderId} onClick={() => onSelect(order.orderId)}>
      <td>{order.orderId}</td><td>{order.line}</td><td>{order.progressPct}%</td>
    </tr>
  ))}</tbody></table>;
}
Check with Python
line_summary = (
    orders.groupby("line")
    .agg(
        number_of_items_indicated=("order_id", "size"),
        pay_attention_to_the_number_of_cases=("needs_attention", "sum"),
        number_of_abnormal_stops=("machine_status", lambda s: s.eq("abnormal stop").sum()),
        average_progress_rate=("progress_pct", "mean"),
    )
)
line_summary["Rate of Attention"] = line_summary["pay_attention_to_the_number_of_cases"] / line_summary["number_of_items_indicated"]
line_summary["average_progress_rate"] = line_summary["average_progress_rate"].round(1)
display(line_summary.style.format({"Rate of Attention": "{:.1%}", "average_progress_rate": "{:.1f}%"}))

ax = line_summary["Rate of Attention"].mul(100).plot(kind="bar", color="#E07A5F", figsize=(7, 4))
ax.set_title("Critical Work Instruction Rate by Line")
ax.set_xlabel("Production Line")
ax.set_ylabel("Pay attention to the rate (%)")
ax.grid(axis="y", alpha=0.3)
plt.xticks(rotation=0)
plt.tight_layout()
plt.show()| number_of_items_indicated | pay_attention_to_the_number_of_cases | number_of_abnormal_stops | average_progress_rate | Rate of Attention | |
|---|---|---|---|---|---|
| line | |||||
| No.1Line | 130 | 89 | 4 | 67.1% | 68.5% |
| No.2Line | 127 | 72 | 7 | 69.5% | 56.7% |
| No.3Line | 103 | 65 | 9 | 71.8% | 63.1% |
Reading the results
Displaying attention rates by line may reveal priorities different from simple case count order. In React’s list, it is effective to separate aggregation cards from statement sheets and narrow down cards to the relevant item. Rather than relying solely on color, the “Caution” label and number of cases are indicated together so that on-site terminals can identify the difference.
No.044: Creating a Detailed Screen
Meaning in Practice
The detail screen is where you decide who will respond to any anomalies you notice in the list, and by what and by when. Not only basic attributes but also the reason for the anomaly, achievements, history, and guidance to related equipment are required.
Approach to Analysis and Modeling
Critical instructions are scored based on priority, overdue deliveries, defect rates, and equipment shutdowns.
This score is not an absolute risk level displayed on the screen as is, but rather an example of selecting detailed verification targets. Weighting must be agreed upon based on operational rules for safety, quality, and delivery deadlines.
function OrderDetail({ order }) {
  return <section>
    <h2>{order.orderId}</h2>
    <StatusBadge status={order.machineStatus} />
    <dl><dt>non_performing_rate</dt><dd>{order.defectRatePct}%</dd></dl>
  </section>;
}
Check with Python
risk = (
    3 * orders["priority"].eq("high").astype(int)
    + 2 * orders["overdue"].astype(int)
    + 2 * orders["defect_rate_pct"].ge(1.5).astype(int)
    + 3 * orders["machine_status"].eq("abnormal stop").astype(int)
)
detail_candidates = orders.assign(risk_score=risk).sort_values(
    ["risk_score", "planned_at"], ascending=[False, True]
)
detail_cols = ["order_id", "line", "product", "planned_at", "priority", "progress_pct", "defect_rate_pct", "machine_status", "risk_score"]
display(detail_candidates[detail_cols].head(8))

selected = detail_candidates.iloc[0]
timeline = pd.DataFrame({
    "time": [selected["planned_at"] - pd.Timedelta(hours=4), selected["planned_at"] - pd.Timedelta(hours=1), selected["planned_at"]],
    "Events": ["Issuing work instructions", "Facility Status Updated", "Scheduled Start Time"],
})
print(f"Detailed display targets: {selected['order_id']} / Risk Score: {selected['risk_score']}")
display(timeline)| order_id | line | product | planned_at | priority | progress_pct | defect_rate_pct | machine_status | risk_score | |
|---|---|---|---|---|---|---|---|---|---|
| 55 | WO-0056 | No.1Line | CZ-300 | 2026-06-07 01:00:00 | high | 64.0 | 0.23 | abnormal stop | 8 |
| 10 | WO-0011 | No.3Line | BZ-110 | 2026-06-02 09:00:00 | middle | 72.0 | 1.85 | abnormal stop | 7 |
| 259 | WO-0260 | No.2Line | AX-200 | 2026-06-03 17:00:00 | high | 44.0 | 2.14 | operation | 7 |
| 353 | WO-0354 | No.1Line | AX-100 | 2026-06-04 17:00:00 | high | 77.0 | 3.44 | inspection | 7 |
| 18 | WO-0019 | No.3Line | AX-100 | 2026-06-04 20:00:00 | high | 66.0 | 2.46 | operation | 7 |
| 39 | WO-0040 | No.3Line | CZ-300 | 2026-06-05 23:00:00 | middle | 50.0 | 1.58 | abnormal stop | 7 |
| 347 | WO-0348 | No.3Line | AX-200 | 2026-06-16 03:00:00 | high | 33.0 | 2.08 | Stage selection | 7 |
| 335 | WO-0336 | No.1Line | CZ-300 | 2026-06-18 08:00:00 | high | 61.0 | 2.37 | operation | 7 |
Detailed Display: WO-0056 / Risk Score: 8| time | Events | |
|---|---|---|
| 0 | 2026-06-06 21:00:00 | Issuing work instructions |
| 1 | 2026-06-07 00:00:00 | Facility Status Updated |
| 2 | 2026-06-07 01:00:00 | Scheduled Start Time |
Reading the results
On the detail screen, not only scores but also the underlying factors such as “high priority,” “late delivery,” “defect rate,” and “abnormal stoppage” are displayed individually. Staff can verify the evidence and respond accordingly, maintaining explainability even when score calculation rules are changed. Separate the history from the current value so you can track it by time.
No.045: Creating the Input Form
Meaning in Practice
The performance input form is the gateway to data quality. Do not display item names as DB column names; instead, provide units and explanations that workers can understand. Values that can be confirmed from work instructions are displayed initially, reducing re-entry.
Approach to Analysis and Modeling
Input time is approximated by “number of manual input items × time per item + screen switching time,” and the reduction effect is observed based on initial values and choices. Here, we compare using fixed scenarios that simulate on-site observation.
function ResultForm({ order }) {
  const [values, setValues] = useState({ goodQty: "", defectQty: "" });
  const update = event => setValues(v => ({ ...v, [event.target.name]: event.target.value }));
  return <form><input name="goodQty" value={values.goodQty} onChange={update} /></form>;
}
Check with Python
form_fields = pd.DataFrame({
    "item": ["work instructionID", "Product Number", "good_quantity", "defective_count", "processing temperature", "worker", "Reasons for Bad Conduct"],
    "Input Method": ["From instructions to automatic", "From instructions to automatic", "Numerical input", "Numerical input", "Numerical input", "Login Information", "Conditional choice"],
    "Essential condition": ["Always", "Always", "Always", "Always", "Always", "Always", "bad10more than several"],
    "Manual input seconds": [0, 0, 8, 7, 7, 0, 10],
})
display(form_fields)

baseline_seconds = 7 * 8 + 12
designed_seconds = form_fields["Manual input seconds"].sum() + 4
comparison = pd.Series({"All fields entered manually": baseline_seconds, "Initial values and conditional branches available": designed_seconds})
ax = comparison.plot(kind="bar", color=["#D1495B", "#2E86AB"], figsize=(7, 4))
ax.set_title("1Design Comparison of Input Time per Item")
ax.set_xlabel("Foam Design")
ax.set_ylabel("Estimated input time (seconds)")
ax.grid(axis="y", alpha=0.3)
plt.xticks(rotation=0)
plt.tight_layout()
plt.show()
print(f"Reduction of Expected Data Entry Time: {baseline_seconds - designed_seconds}seconds/Case ({1-designed_seconds/baseline_seconds:.1%})")| item | Input Method | Essential condition | Manual input seconds | |
|---|---|---|---|---|
| 0 | work instructionID | From instructions to automatic | Always | 0 |
| 1 | Product Number | From instructions to automatic | Always | 0 |
| 2 | good_quantity | Numerical input | Always | 8 |
| 3 | defective_count | Numerical input | Always | 7 |
| 4 | processing temperature | Numerical input | Always | 7 |
| 5 | worker | Login Information | Always | 0 |
| 6 | Reasons for Bad Conduct | Conditional choice | bad10more than several | 10 |
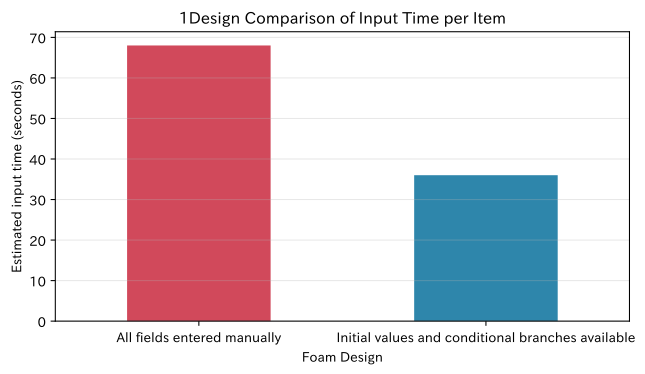
Reduction of expected input time: 32 seconds per entry (47.1%)Reading the results
By using initial values and conditional displays, it is expected that operations per transaction can be greatly reduced. By multiplying by the number of cases, you can estimate the daily time savings. However, the automatically set values are not hidden; instead, the display is read-only so you can check if incorrect work instructions have been selected.
No.046: Validate your form
Meaning in Practice
Validation is not designed to make input more strict, but rather a mechanism that informs you of how to correct it before it flows to subsequent processes. Before registration, it detects discrepancies such as negative good product counts, the total number of good and defective products exceeding the planned number, temperatures outside the control range, and serious defects without reason.
Approach to Analysis and Modeling
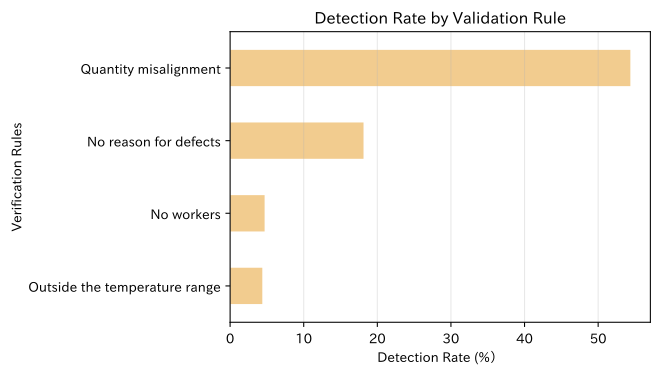
Check the detection rates and overlaps for each rule. Frontend verification is effective for rapid feedback, but since there are also direct API calls, the same business rules must always be verified on the server side.
function validate(values, plannedQty) {
  const errors = {};
  if (values.goodQty < 0) errors.goodQty = "0Please enter the above";
  if (values.goodQty + values.defectQty > plannedQty) errors.qty = "Keep the total below the planned number";
  return errors;
}
Check with Python
validation_counts = forms[["qty_invalid", "temperature_invalid", "reason_invalid", "operator_invalid"]].sum()
validation_counts.index = ["Quantity misalignment", "Outside the temperature range", "No reason for defects", "No workers"]
validation_table = pd.DataFrame({
    "Number of Detected Cases": validation_counts,
    "detection rate": validation_counts / len(forms),
})
display(validation_table.style.format({"detection rate": "{:.1%}"}))

ax = validation_table["detection rate"].mul(100).sort_values().plot(kind="barh", color="#F2CC8F", figsize=(7, 4))
ax.set_title("Detection Rate by Validation Rule")
ax.set_xlabel("Detection Rate (%)")
ax.set_ylabel("Verification Rules")
ax.grid(axis="x", alpha=0.3)
plt.tight_layout()
plt.show()
print(f"at least1Input with inconsistencies: {(~forms['is_valid']).mean():.1%}")| Number of Detected Cases | detection rate | |
|---|---|---|
| Quantity misalignment | 174 | 54.4% |
| Outside the temperature range | 14 | 4.4% |
| No reason for defects | 58 | 18.1% |
| No workers | 15 | 4.7% |
Input with at least one inconsistency: 65.3%Reading the results
By understanding which rules tend to cause input freezes, you can identify not just user errors but also initial values, unit displays, choices, and work procedures that need improvement. Error messages should not be “fraudulent” but indicate corrective actions, such as “Please reduce the total number of good and defective products to below the planned number.”
No.047: Calling APIs from React
Meaning in Practice
React serves as the browser screen, and requests for work instructions and achievement registration are handled by the API. API calls are designed not only for URLs and HTTP methods but also to prevent timeouts, cancellations, retrys, and duplicate registrations.
Approach to Analysis and Modeling
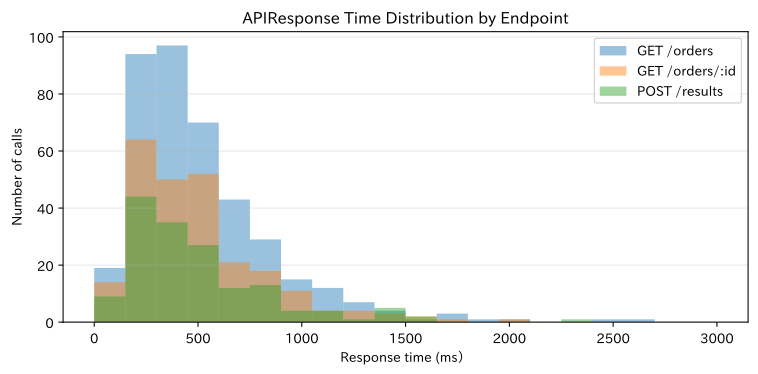
Check medians, 95th percentiles, and failure rates by endpoint. Since the average value alone overlooks some of the long wait times, we will also list the 95th percentile . Automatic retry of the registration API requires mechanisms such as idempotent keys to prevent duplicate registrations.
async function fetchOrders(signal) {
  const response = await fetch("/api/orders", { signal });
  if (!response.ok) throw new Error(`HTTP ${response.status}`);
  return response.json();
}
Check with Python
api_summary = (
    api_logs.groupby("endpoint")
    .agg(
        number_of_outflows=("latency_ms", "size"),
        median_ms=("latency_ms", "median"),
        p95_ms=("latency_ms", lambda s: s.quantile(0.95)),
        failure_rate=("failed", "mean"),
    )
    .round({"median_ms": 0, "p95_ms": 0, "failure_rate": 3})
)
display(api_summary.style.format({"median_ms": "{:.0f}", "p95_ms": "{:.0f}", "failure_rate": "{:.1%}"}))

fig, ax = plt.subplots(figsize=(8, 4))
for endpoint, group in api_logs.groupby("endpoint"):
    ax.hist(group["latency_ms"], bins=np.arange(0, 3100, 150), alpha=0.45, label=endpoint)
ax.set_title("APIResponse Time Distribution by Endpoint")
ax.set_xlabel("Response time (ms)")
ax.set_ylabel("Number of calls")
ax.grid(axis="y", alpha=0.3)
ax.legend()
plt.tight_layout()
plt.show()| number_of_outflows | median_ms | p95_ms | failure_rate | |
|---|---|---|---|---|
| endpoint | ||||
| GET /orders | 398 | 430 | 1184 | 3.5% |
| GET /orders/:id | 245 | 429 | 1118 | 2.0% |
| POST /results | 157 | 418 | 1245 | 2.5% |
Reading the results
Even if the median is within an acceptable range, some users will have to wait long periods in the long hem distribution. On React’s side, the state changes to loading when communication starts, and once a certain amount of time is exceeded, it clearly indicates that it is in standby. Since retries for acquisition and registration processes have different overlapping effects, it is important not to implement them in the same way.
No.048: Displaying API Responses on Screen
Meaning in Practice
If you simply send API responses directly to the table, it becomes difficult for users to understand code values, missing values, dates, and units. API data is converted into display models for screens, consolidating display rules in one place.
Approach to Analysis and Modeling
Separate the data acquisition layer and the display conversion layer. For example, you can create display labels based on progress rate and equipment status, and convert the scheduled date and time into on-site notation. Missing values are not left blank, and data acquisition failures are distinguished between unregistered and failed data acquisition.
const toOrderViewModel = order => ({
  id: order.order_id,
  schedule: new Intl.DateTimeFormat("ja-JP", { dateStyle: "short", timeStyle: "short" }).format(new Date(order.planned_at)),
  progress: `${order.progress_pct}%`,
});
Check with Python
api_response = orders.head(8)[["order_id", "line", "product", "planned_at", "progress_pct", "machine_status", "needs_attention"]].copy()
status_label = np.select(
    [api_response["machine_status"].eq("abnormal stop"), api_response["progress_pct"].eq(100), api_response["progress_pct"].gt(0)],
    ["Stop/Response Required", "Finished", "in manufacturing"],
    default="not yet started",
)
view_model = pd.DataFrame({
    "work instruction": api_response["order_id"],
    "Line & Model Number": api_response["line"] + " / " + api_response["product"],
    "Schedule": api_response["planned_at"].dt.strftime("%m/%d %H:%M"),
    "progress": api_response["progress_pct"].map(lambda x: f"{x:.0f}%"),
    "Display Status": status_label,
    "Response": np.where(api_response["needs_attention"], "Confirmation required", "usually"),
})
print("APIResponse (internal expression)")
display(api_response.head(4))
print("Screen Display Model")
display(view_model)
API Response (Internal Representation)| order_id | line | product | planned_at | progress_pct | machine_status | needs_attention | |
|---|---|---|---|---|---|---|---|
| 0 | WO-0001 | No.1Line | CZ-300 | 2026-06-13 04:00:00 | 73.0 | operation | True |
| 1 | WO-0002 | No.3Line | BZ-110 | 2026-06-10 13:00:00 | 56.0 | operation | True |
| 2 | WO-0003 | No.2Line | CZ-300 | 2026-06-12 20:00:00 | 60.0 | operation | True |
| 3 | WO-0004 | No.2Line | BZ-110 | 2026-06-08 07:00:00 | 19.0 | operation | True |
Screen Display Model| work instruction | Line & Model Number | Schedule | progress | Display Status | Response | |
|---|---|---|---|---|---|---|
| 0 | WO-0001 | No.1Line / CZ-300 | 06/13 04:00 | 73% | in manufacturing | Confirmation required |
| 1 | WO-0002 | No.3Line / BZ-110 | 06/10 13:00 | 56% | in manufacturing | Confirmation required |
| 2 | WO-0003 | No.2Line / CZ-300 | 06/12 20:00 | 60% | in manufacturing | Confirmation required |
| 3 | WO-0004 | No.2Line / BZ-110 | 06/08 07:00 | 19% | in manufacturing | Confirmation required |
| 4 | WO-0005 | No.3Line / CZ-300 | 06/09 11:00 | 78% | in manufacturing | Confirmation required |
| 5 | WO-0006 | No.1Line / AX-100 | 06/07 12:00 | 53% | in manufacturing | Confirmation required |
| 6 | WO-0007 | No.1Line / CZ-300 | 06/28 03:00 | 30% | in manufacturing | usually |
| 7 | WO-0008 | No.3Line / AX-100 | 06/26 11:00 | 100% | Finished | usually |
Reading the results
When converted to a display model, you can avoid leaking API column names and code structures across the entire screen. In React, transform functions are extracted as testable pure functions and the rules for date, time, unit, missing values, and labels are checked. However, the priority for “stop” and “completion” is agreed upon with the business manager, and there are no custom rules based solely on the screen.
No.049: Creating Search and Filter UI
Meaning in Practice
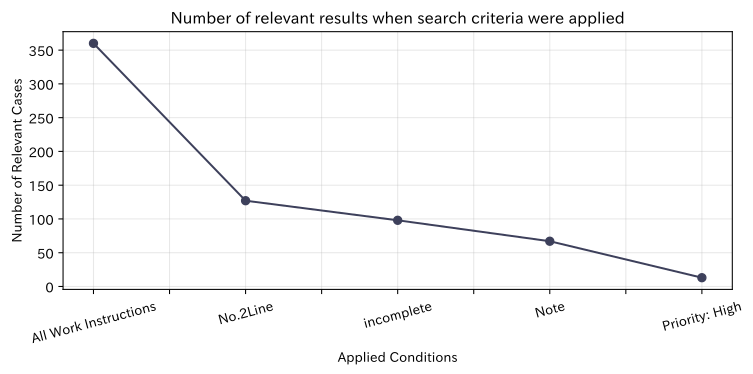
The search UI does not become more convenient simply by listing more conditions. It is important that the team leader can complete key tasks such as searching for “second line of incomplete and noteworthy items” in a short operation before the morning meeting.
Approach to Analysis and Modeling
Apply filtering criteria stepwise to see how many cases the population decreases from one to a certain number. If there are zero search results, the condition is displayed and the removal operation is displayed to show whether the data does not exist or the conditions are too strict.
const visibleOrders = useMemo(() => orders.filter(order =>
  (line === "all" || order.line === line) &&
  (!attentionOnly || order.needsAttention)
), [orders, line, attentionOnly]);
Check with Python
filter_steps = []
filtered = orders.copy()
filter_steps.append(("All Work Instructions", len(filtered)))
filtered = filtered[filtered["line"] == "No.2Line"]
filter_steps.append(("No.2Line", len(filtered)))
filtered = filtered[filtered["status"] != "Finished"]
filter_steps.append(("incomplete", len(filtered)))
filtered = filtered[filtered["needs_attention"]]
filter_steps.append(("Note", len(filtered)))
filtered = filtered[filtered["priority"] == "high"]
filter_steps.append(("Priority: High", len(filtered)))

filter_funnel = pd.DataFrame(filter_steps, columns=["condition", "Number of Relevant Cases"])
filter_funnel["Initial Count Ratio"] = filter_funnel["Number of Relevant Cases"] / len(orders)
display(filter_funnel.style.format({"Initial Count Ratio": "{:.1%}"}))
display(filtered[["order_id", "product", "planned_at", "progress_pct", "defect_rate_pct", "machine_status"]].head(10))

ax = filter_funnel.plot(x="condition", y="Number of Relevant Cases", marker="o", color="#3D405B", legend=False, figsize=(8, 4))
ax.set_title("Number of relevant results when search criteria were applied")
ax.set_xlabel("Applied Conditions")
ax.set_ylabel("Number of Relevant Cases")
ax.grid(alpha=0.3)
plt.xticks(rotation=15)
plt.tight_layout()
plt.show()| condition | Number of Relevant Cases | Initial Count Ratio | |
|---|---|---|---|
| 0 | All Work Instructions | 360 | 100.0% |
| 1 | No.2Line | 127 | 35.3% |
| 2 | incomplete | 98 | 27.2% |
| 3 | Note | 67 | 18.6% |
| 4 | Priority: High | 13 | 3.6% |
| order_id | product | planned_at | progress_pct | defect_rate_pct | machine_status | |
|---|---|---|---|---|---|---|
| 11 | WO-0012 | AX-200 | 2026-06-17 00:00:00 | 40.0 | 1.44 | Stage selection |
| 21 | WO-0022 | CZ-300 | 2026-06-29 18:00:00 | 78.0 | 2.13 | operation |
| 45 | WO-0046 | BZ-110 | 2026-06-11 07:00:00 | 70.0 | 1.02 | operation |
| 68 | WO-0069 | BZ-110 | 2026-06-12 18:00:00 | 68.0 | 0.46 | inspection |
| 69 | WO-0070 | AX-100 | 2026-06-03 19:00:00 | 74.0 | 0.32 | operation |
| 108 | WO-0109 | AX-200 | 2026-06-05 15:00:00 | 60.0 | 0.61 | operation |
| 140 | WO-0141 | BZ-110 | 2026-06-13 19:00:00 | 76.0 | 0.81 | Stage selection |
| 171 | WO-0172 | CZ-300 | 2026-06-20 19:00:00 | 87.0 | 0.43 | operation |
| 201 | WO-0202 | AX-200 | 2026-06-11 16:00:00 | 51.0 | 0.45 | Stage selection |
| 228 | WO-0229 | AX-100 | 2026-06-10 17:00:00 | 46.0 | 0.77 | operation |
Reading the results
By applying the key conditions in order, you can reduce the number of cases to a realistic level. In the UI, frequent usage conditions are saved as presets, and by displaying the number of items each time the condition changes, you can understand the strength of the filter before it reaches zero. For search term input, to avoid excessive API calls, consider debounce by waiting for input for a certain period.
No.050: Implementing Loading Error Display
Meaning in Practice
The screen shows not only successes but also initial display, loading, empty data, communication failures, insufficient permissions, and successes after retrying. If these are not designed as explicit states, white screens and old data will appear normal.
Approach to Analysis and Modeling
UI states are classified based on response time and failure status, and simulations are conducted assuming user completion rates for each state. Compare the completion rate with fixed seeds depending on the loading display and specific retry instructions.
if (state === "loading") return <LoadingPanel message="Loading work instructions" />;
if (state === "error") return <ErrorPanel message="Could not obtain" onRetry={loadOrders} />;
if (orders.length === 0) return <EmptyPanel message="There are no work instructions that match the conditions." />;
return <OrderTable orders={orders} />;
Check with Python
ui_events = api_logs.copy()
ui_events["Condition"] = np.select(
    [ui_events["failed"], ui_events["latency_ms"] >= 1200, ui_events["latency_ms"] >= 500],
    ["error", "long wait", "short wait"],
    default="Instant Display",
)
state_summary = ui_events.groupby("Condition").agg(number_of_cases=("endpoint", "size"), average_response_ms=("latency_ms", "mean"))
state_summary["composition_ratio"] = state_summary["number_of_cases"] / len(ui_events)
display(state_summary.style.format({"average_response_ms": "{:.0f}", "composition_ratio": "{:.1%}"}))

completion_prob = {
    "No display": {"Instant Display": 0.98, "short wait": 0.90, "long wait": 0.60, "error": 0.18},
    "Status display available": {"Instant Display": 0.98, "short wait": 0.96, "long wait": 0.84, "error": 0.58},
}
simulation_rng = np.random.default_rng(SEED + 50)
rates = {}
for design, probs in completion_prob.items():
    completed = [simulation_rng.random() < probs[state] for state in ui_events["Condition"]]
    rates[design] = np.mean(completed)
completion = pd.Series(rates)

ax = completion.mul(100).plot(kind="bar", color=["#D1495B", "#2E86AB"], figsize=(7, 4))
ax.set_title("Simulation of operation completion rate through status display design")
ax.set_xlabel("UIDesign")
ax.set_ylabel("Operation completion rate (%)")
ax.set_ylim(0, 100)
ax.grid(axis="y", alpha=0.3)
plt.xticks(rotation=0)
plt.tight_layout()
plt.show()
print(completion.map(lambda x: f"{x:.1%}"))| number_of_cases | average_response_ms | composition_ratio | |
|---|---|---|---|
| Condition | |||
| error | 23 | 594 | 2.9% |
| Instant Display | 457 | 299 | 57.1% |
| short wait | 283 | 717 | 35.4% |
| long wait | 37 | 1518 | 4.6% |
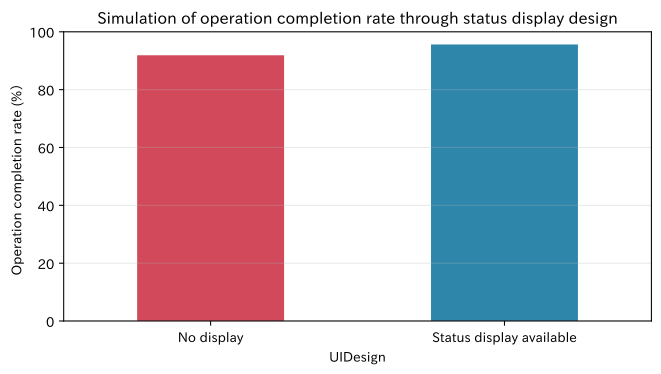
No display: 91.9%
Status Display 95.6%
dtype: str
Reading the results
These results are simulations based on assumptions and do not represent actual effects. However, clearly indicating communication status and providing “retry” for errors, “retention of input,” and “number to provide when contacted” can be considered KPIs for business continuity. After live implementation, the completion rate, retry rate, and duplicate transfer rate are measured from the operation log, and the assumptions are updated.
Practical Implications Seen Through Target Exercise
-
Component boundaries are also boundaries of business responsibilities.
By separating status display, list, details, and achievement input, it becomes easier to manage display rules and change impacts. -
The roles of the list and details differ
The list focuses on identifying targets to respond, while the details focus on confirming the basis for judgment and the next steps. -
Input quality cannot be maintained by the screen alone.
While verifying immediately in React, the same business rules are also verified on the API side, and the results are recorded in an auditable format. -
APIPerformance translates into the user’s task completion rate
Track not only response times and failure rates but also the impact on churn, retrys, double registrations, and inquiries. -
Explicitly designing normal, empty, standby, and failure
Instead of retroactively applying exception states, we include them from the start in screen design and acceptance test scenarios.
What is necessary for practical implementation
1. Check usage status and business rules
We check users, devices, whether gloves are present, network quality, peak number of cases, and decision deadlines through on-site observation and interviews. Validation and priority scores are managed as agreements in quality assurance, production management, and information systems.
2. Definition of API Contracts and State Transitions
Define the request response type, error code, timeout, retry status, and idempotency. Screen states must at least distinguish between idle / loading / success / empty / error, and the display and operation of each state should be accepted as the acceptance conditions.
3. Accessibility and verification on site terminals
Make sure the display is color-independent, with sufficient font and button sizes, keyboard operation, and readable labels. Usability testing is conducted in actual tablets, lighting, noise, and network environments.
4. Operational KPIs and Improvement Cycles
Continuously measures target discovery time, input completion rate, validation occurrence rate, API , retry rate, and number of inquiries. Instead of using it for personal evaluation, use it as material to determine areas where improvements are needed in the screen, business procedures, training, and API.
5. Security and Auditing
Simply hiding it on the screen does not grant permission control. Authorization is performed via API, and values before and after changes, operators, times, and reasons are recorded in the audit log. The retention period and viewing scope of production and quality data are also specified.
Conclusion
From No.041 to No.050, we examined everything from React’s basic configuration to error display as a series of designs for factory work instruction apps. The important thing is not to use React’s features themselves, but to separate states and components according to on-site judgment units, making screen states that include API uncertainties explainable.
From Python-based hypothetical data analysis, we also confirmed that screen design can be connected to business KPIs such as attention rate in lists, input inconsistencies, API response distribution, number of filters, and operation completion rates. In practice, updating assumptions through actual operation logs and user observations and gradually improving from a small screen is effective.
Consultations for Corporations
At Suri Kobo, we support the design and development of web systems and business interfaces for continuous use in manufacturing industries, including business operations, data analysis, and AI and mathematical model development.
- Want to migrate paper/Excel tasks to a web system
- Want to visualize production, quality, and equipment data in a clear and visible way on-site.
- Want to embed analysis models and optimization results into business screens
- Want to design APIs, frontends, and operational KPIs all in one place.
For issues like these, you can consult with us from concept organization, prototyping, implementation, to operational design.
📩 Contact Us: surikobo.co.jp/contact
Please feel free to consult us first.