
100 Exercises / Python / 100 Python Exercises for Data Analysis
Display characters with the print function
Introduction to Python for reading and writing manufacturing data using file operations and CSV
100 Exercises Chapter 6 (No.051-No.060): File operations and CSV
This article is Chapter 6 of the “100 Exercises on Introduction to Python for Data Analysis” series.
In Chapter 5 (No.041-050), we learned about functions, modules, and exception handling.
In this chapter, File reading/writing/CSV input/output Learn using quality inspection data and sales data from auto parts factories.
[!NOTE] This material is a notebook that has been used in corporate training by Surikobo (or its representative, Hiroshi Wayama) in the past, and has been reorganized and edited with the permission of the company and published.
All published data is fictitious and has no relation to actual companies, factories, or numbers.
Introduction: Practical issues in the manufacturing industry covered in this article
Mr. S, who is in charge of quality control at an auto parts factory, does this kind of work every day.
daily work
  1. Check the quality data (CSV) output from the inspection terminal of each line
  2. Record the warning details of lines whose defect rate exceeds the threshold in a text file
  3. Aggregate quality inspection CSV at the end of the month and output a summary of defect rate by line.
  4. Create a report by summarizing monthly sales by product line from the sales CSV.
By mastering these file operations and CSV processing with Python, Completely freed from manual aggregation, copying and posting.
Common situations in the field
| Scene | Task |
|---|---|
| Quality data collection | CSV is automatically output from inspection terminals on each line, but aggregation is done manually |
| Alert record | Manually copying and pasting the alert content when the threshold is exceeded into Excel |
| Monthly aggregation | At the end of the month, 30 days worth of CSV is checked line by line and totaled |
| Exporting results | Manually copying aggregation results to a new CSV or text |
| Sales aggregation | It takes several hours every month to compile the sales CSV on a monthly basis |
If you use Python’s open() / csv module, you can automatically process these regardless of the number of data rows.
Why is this problem difficult to judge?
While it may seem like “just open the file and read it,” in the context of manufacturing data, it has the following pitfalls:
-
Forgetting to close files If an error occurs after
f = open(...),f.close()will not be called. The file handle remains. You can completely prevent this problem by using thewithstatement -
Character code issue (UTF-8 vs Shift-JIS) The CSV output by the factory inspection terminal may be Shift-JIS (cp932) It is safe to specify
open(..., encoding='utf-8')orencoding='cp932' -
All CSV values are string types The number read by
csv.readeris a string'850'Must be converted to numeric type withint(row[4])orfloat(row[6]) -
Incorrectly treating header rows as data If you don’t skip the first row (column names) with
next(reader), I get a conversion error likeint('Production number') -
Double line break due to omission of
newline=''If you omitopen(..., newline='')when usingcsv.writer, An issue occurs where a blank line is inserted at the end of a line in a Windows environment.
Overall picture of the exercises covered in this chapter
| No. | Title | Usage in manufacturing industry |
|---|---|---|
| 051 | Load file | Load production daily report text with open() |
| 052 | Write to file | Export quality alert report to text file |
| 053 | Handle files safely with the with statement | Safely read and write line summary summaries with open() |
| 054 | Understanding the structure of CSV files | Quality inspection Check the raw structure of CSV (delimiters, headers, columns) |
| 055 | Load CSV with csv module | Load quality inspection CSV with csv.reader |
| 056 | Process CSV rows one by one | Determine the defect rate of each row and total the number of alerts |
| 057 | Extract specific columns from CSV | Extract product code, production quantity, and defect rate by column index |
| 058 | Totaling numerical columns in CSV | Aggregating and visualizing production numbers and defects by line directly from CSV |
| 059 | Export processing results to CSV | Export aggregation summary to a new CSV file |
| 060 | Aggregating monthly sales from sales CSV | Aggregating and graphing sales CSV by month and product using DictReader |
Preparing the Python environment
import subprocess, sys

res = subprocess.run(["sw_vers", "-productVersion"], capture_output=True, text=True)
print(f"macOS : {res.stdout.strip()}")
print(f"Python: {sys.version}")
macOS : 26.3
Python: 3.13.1 (main, Dec 3 2024, 17:59:52) [Clang 16.0.0 (clang-1600.0.26.4)]import csv
import os
import tempfile
from collections import defaultdict
from datetime import date, timedelta
import numpy as np
import matplotlib
import matplotlib.pyplot as plt
import matplotlib.ticker as ticker
matplotlib.rcParams['font.family'] = 'Hiragino Maru Gothic Pro'
%config InlineBackend.figure_format = 'svg'
np.random.seed(42)
print("Library loading completed")
print(f" NumPy : {np.__version__}")
print(f" Matplotlib : {matplotlib.__version__}")Library loading completed NumPy: 2.5.1 Matplotlib: 3.11.0
Creation of fictitious data
Assumed scenario: Auto parts factory / quality control/sales management team Data type: Production daily report text/quality inspection CSV (3 months)/sales CSV (3 months)
Save the file in your system’s temporary directory (tempfile.gettempdir()).
In practice, specify the path of a shared folder or a predetermined directory.
# ===== File save destination =====
WORK_DIR = tempfile.gettempdir()
REPORT_TXT = os.path.join(WORK_DIR, "kobo_daily_report.txt")
QUALITY_CSV = os.path.join(WORK_DIR, "kobo_quality_check.csv")
SUMMARY_CSV = os.path.join(WORK_DIR, "kobo_quality_summary.csv")
SALES_CSV = os.path.join(WORK_DIR, "kobo_monthly_sales.csv")

np.random.seed(42)

# ===== Line/Product Master =====
lines_config = [
    {"line": "A-line", "code": "EG-1001", "name": "Engine parts A", "plan": 850, "price": 4200, "defect_base": 0.012},
    {"line": "B line", "code": "EG-1002", "name": "Engine parts B", "plan": 720, "price": 3800, "defect_base": 0.018},
    {
        "line": "C line",
        "code": "HN-2001",
        "name": "harness unit",
        "plan": 1200,
        "price": 1500,
        "defect_base": 0.025,
    },
    {
        "line": "D line",
        "code": "SN-3001",
        "name": "sensor module",
        "plan": 950,
        "price": 2800,
        "defect_base": 0.015,
    },
    {"line": "E line", "code": "FR-4001", "name": "frame parts", "plan": 630, "price": 5500, "defect_base": 0.010},
]


# ===== Business days generated from January to March 2025 =====
def business_days(start, end):
    days = []
    d = start
    while d <= end:
        if d.weekday() < 5:
            days.append(d)
        d += timedelta(days=1)
    return days


bdays = business_days(date(2025, 1, 6), date(2025, 3, 31))

# ===== Generation of quality inspection CSV (around 330 lines) =====
quality_rows = []
for d in bdays:
    for lc in lines_config:
        actual = int(lc["plan"] * np.random.uniform(0.92, 1.08))
        dr = lc["defect_base"] * np.random.uniform(0.5, 2.5)
        defect = int(actual * dr)
        quality_rows.append(
            {
                "date": d.isoformat(),
                "line": lc["line"],
                "Product code": lc["code"],
                "Product name": lc["name"],
                "Production number": actual,
                "Number of defects": defect,
                "Defect rate": round(dr * 100, 2),
            }
        )

with open(QUALITY_CSV, "w", newline="", encoding="utf-8") as f:
    writer = csv.DictWriter(f, fieldnames=["date", "line", "Product code", "Product name", "Production number", "Number of defects", "Defect rate"])
    writer.writeheader()
    writer.writerows(quality_rows)

# ===== Generation of production daily report text =====
last_date = bdays[-1]
last_rows = [r for r in quality_rows if r["date"] == last_date.isoformat()]
report_lines_list = [
    f"=== {last_date.isoformat()} production daily report ===",
    "Person in charge: Taro Tanaka",
    "Approved by: Manager Yamamoto",
    "",
    "[Production results by line]",
]
for r in last_rows:
    report_lines_list.append(
        f"  {r['line']}: production {r['Production number']:,}units / defective {r['Number of defects']}units / Defect rate {r['Defect rate']:.2f}%"
    )
report_lines_list += [
    "",
    "[Summary]",
    "Today's production on all lines generally proceeded as planned.",
    "Since the C line defect rate is on the rise compared to the previous day, we will conduct an inspection tomorrow morning.",
]
with open(REPORT_TXT, "w", encoding="utf-8") as f:
    f.write("\n".join(report_lines_list))

# ===== Generate sales CSV =====
sales_rows = []
for d in bdays:
    for lc in lines_config:
        qty = int(lc["plan"] * np.random.uniform(0.85, 1.15))
        amount = qty * lc["price"]
        sales_rows.append(
            {
                "date": d.isoformat(),
                "Product code": lc["code"],
                "Product name": lc["name"],
                "quantity": qty,
                "unit price": lc["price"],
                "amount": amount,
            }
        )

with open(SALES_CSV, "w", newline="", encoding="utf-8") as f:
    writer = csv.DictWriter(f, fieldnames=["date", "Product code", "Product name", "quantity", "unit price", "amount"])
    writer.writeheader()
    writer.writerows(sales_rows)

print("=== Fictitious data generation completed ===")
print(f"quality inspection CSV : {QUALITY_CSV}")
print(f"  number of lines : {len(quality_rows):,} Row (excluding header)")
print(f"production daily report TXT : {REPORT_TXT}")
print(f"sales CSV     : {SALES_CSV}")
print(f"  number of lines : {len(sales_rows):,} Row (excluding header)")
print(f"Business days     : {len(bdays)} day (2025-01-06~2025-03-31)")
=== Fictitious data generation completed === Quality check CSV: /var/folders/3y/fmw40k0x78xblvb3gkcyvy1h0000gn/T/kobo_quality_check.csv Number of lines: 305 lines (excluding header) Production daily report TXT: /var/folders/3y/fmw40k0x78xblvb3gkcyvy1h0000gn/T/kobo_daily_report.txt Sales CSV: /var/folders/3y/fmw40k0x78xblvb3gkcyvy1h0000gn/T/kobo_monthly_sales.csv Number of lines: 305 lines (excluding header) Business days: 61 days (2025-01-06 to 2025-03-31)
No.051: Load file
Practical meaning
Factory inspection terminals and production management systems generate logs and daily reports for each work period.
It may be output as a text file.
The open() read operation is the starting point for file processing in Python.
Concept of analysis and modeling
Open the file with open(file path, mode, encoding=encode) and
read()— Read the entire file as one stringreadlines()— read as a line-by-line listreadline()— Read one line at a time
There are 3 ways to read. read() is useful for checking text files.
Check with Python
# No.051: Read the file with open()
print(f"=== No.051: load file ===")
print(f"loading file: {REPORT_TXT}")
print()

# Open a file in read mode ("r") with open()
f = open(REPORT_TXT, "r", encoding="utf-8")
content = f.read()  # Read the entire file as one string
f.close()  # Always close() (understood as a step before the with statement)

print(content)
print()
print(f"--- File information ---")
print(f"Number of characters: {len(content):,} characters")
print(f"number of lines  : {len(content.splitlines())} rows")
=== No.051: Load file === Load file: /var/folders/3y/fmw40k0x78xblvb3gkcyvy1h0000gn/T/kobo_daily_report.txt
=== 2025-03-31 Production Daily Report ===
Person in charge: Taro Tanaka
Approved by: Manager Yamamoto

[Production results by line]
  A line: Production 804 pieces / Defective 10 pieces / Defect rate 1.27%
  B line: Production 682 pieces / Defective 8 pieces / Defect rate 1.22%
  C line: Production 1,127 pieces / Defective 40 pieces / Defect rate 3.55%
  D line: Production 905 pieces / Defective 16 pieces / Defect rate 1.84%
  E line: Production 630 pieces / Defective 11 pieces / Defect rate 1.88%

[Summary]
Today's production on all lines generally proceeded as planned.
Since the C line defect rate is on the rise compared to the previous day, we will conduct an inspection tomorrow morning.

--- File information ---
Number of characters: 309 characters
Number of lines: 14 lines
Reading the results
Production daily report text (kobo_daily_report.txt) was loaded as 309 characters / 14 lines.
f.read() returns it as a single string with line breaks, so print() displays the contents of the file as is.
According to the results on the last business day (2025-03-31), C line (3.55%) exceeds the warning line.
The summary column automatically includes the entry “Inspection performed”.
However, be careful not to forget to call f.close() — with statement (No.053) solves this problem.
No.052: Write to file
Practical meaning
Quality control requires recording and saving warning contents in a text file.
By automatically exporting daily quality alerts to a file,
The person in charge will be able to refer to it later as evidence.
Concept of analysis and modeling
Open the file in write mode with open(pass, 'w') and write the string with write().
'w'mode: Overwrite (if the file exists, delete the contents and create a new one)'a'mode: Append (add to the end of the file if it exists) Use'a'to add daily logs and'w'to recreate monthly reports.
Check with Python
# No.052: Write to file with open()
ALERT_TXT = os.path.join(WORK_DIR, "kobo_quality_alert.txt")

ALERT_THRESHOLD = 3.0  # Defect rate alert threshold (%)

# Obtain quality data for the latest date (last business day)
latest_date = max(r["date"] for r in quality_rows)
latest_rows = [r for r in quality_rows if r["date"] == latest_date]

# Open file in write mode ("w")
f = open(ALERT_TXT, "w", encoding="utf-8")
f.write(f"=== Quality alert report ({latest_date}) ===\n")
f.write(f"Judgment threshold: Defect rate {ALERT_THRESHOLD}% That's all\n\n")

alert_count = 0
for r in latest_rows:
    dr = float(r["Defect rate"])
    if dr >= ALERT_THRESHOLD:
        f.write(f"[warning] {r['line']}({r['Product code']}): Defect rate {dr:.2f}%\n")
        alert_count += 1

if alert_count == 0:
    f.write("All lines are within normal range today\n")

f.write(f"\nNumber of warning lines: {alert_count} items\n")
f.close()  # Don't forget close()

print(f"Writing completed: {ALERT_TXT}")
print()

# Read the write result for confirmation
f_read = open(ALERT_TXT, "r", encoding="utf-8")
print(f_read.read())
f_read.close()
Writing completed: /var/folders/3y/fmw40k0x78xblvb3gkcyvy1h0000gn/T/kobo_quality_alert.txt
=== Quality Alert Report (2025-03-31) ===
Judgment threshold: Defect rate 3.0% or more

[Warning] C line (HN-2001): Defect rate 3.55%

Number of warning lines: 1 line
Reading the results
Scan each line on the last business day and identify lines with a defect rate of 3.0% or more.
[warning] Exported to text file as flag.
Because of 'w' mode, the file will be overwritten every time you rerun the same code.
If you want to keep a cumulative log of alerts, change to 'a' (append) mode.
It will be appended to the end each time it is executed.
No.053: Handle files safely with the with statement
Practical meaning
After opening a file with open(), if an exception occurs during processing,
f.close() is not called and the file handle remains.
If you use the with statement, it will be automatically closed when exiting the block (even when an exception occurs).
It is a best practice to always use with open() as f: for manufacturing data processing.
Concept of analysis and modeling
with open(...) as f: is a syntax using a context manager.
When exiting the with block, f.__exit__() is automatically called and the file is closed.
- Always use
withstatement for file processing - Read one line at a time with
for line in f:(memory efficient)
Check with Python
# No.053: Safely read and write files with the with statement
SUMMARY_TXT = os.path.join(WORK_DIR, "kobo_line_summary.txt")

print("=== No.053: Handle files safely with the with statement ===")
print()

# --- Write ---
# f.close() is automatically called when you exit the with block.
with open(SUMMARY_TXT, "w", encoding="utf-8") as f:
    f.write("=== Quality summary by line (January to March 2025) ===\n\n")
    for lc in lines_config:
        rows = [r for r in quality_rows if r["line"] == lc["line"]]
        total_p = sum(r["Production number"] for r in rows)
        total_d = sum(r["Number of defects"] for r in rows)
        avg_dr = total_d / total_p * 100 if total_p else 0.0
        f.write(f"  {lc['line']} ({lc['code']}): Cumulative production {total_p:,}units  Average defect rate {avg_dr:.2f}%\n")
    f.write("\n--- Generation completed ---\n")
# ← f.close() is automatically executed here

print(f"Writing completed: {SUMMARY_TXT}")
print()

# --- Read (one line at a time)---
print("=== File contents (read line by line) ===")
with open(SUMMARY_TXT, "r", encoding="utf-8") as f:
    for line_text in f:  # Read file line by line
        print(line_text, end="")  # Specify end="" to avoid duplicate line breaks
=== No.053: Handle files safely with the with statement ===
Writing completed: /var/folders/3y/fmw40k0x78xblvb3gkcyvy1h0000gn/T/kobo_line_summary.txt

=== File contents (read line by line) ===
=== Quality summary by line (January to March 2025) ===

  A-line (EG-1001): Cumulative production: 51,690 pieces Average defect rate: 1.89%
  B line (EG-1002): Cumulative production 43,727 units Average defect rate 2.71%
  C line (HN-2001): Cumulative production 73,157 pieces Average defect rate 3.85%
  D line (SN-3001): Cumulative production 57,698 pieces Average defect rate 2.17%
  E line (FR-4001): Cumulative production 38,546 pieces Average defect rate 1.29%

--- Generation completed ---
Reading the results
A 5-line 3-month summary was generated in the write block of with open(...) as f:.
C-line (HN-2001) average defect rate of 3.85% is the highest and exceeds the threshold of 3.0%.
E line (FR-4001) is the most stable at 1.29%, and together with A line (1.89%), it is an excellent line.
for line_text in f: acts as an iterator that reads the file line by line.
Even with a large CSV of 1 million rows, it is better to use f.read() to expand it all to memory.
Sequential loading of for line in f: is more memory efficient and practical.
No.054: Understand the structure of CSV files
Practical meaning
Before processing the CSV output from the factory inspection system or ERP,
It is essential to check the column structure, data type, and delimiter.
The first step is to read the raw CSV with open() and check the structure.
Concept of analysis and modeling
Basic structure of CSV (Comma-Separated Values):
- 1st row: Header row (column name)
- 2nd and subsequent rows: data rows (comma-separated values)
- Each value is separated by a comma
,(if the value contains a comma, surround it with"...")
If you read it as a raw string with open() and split it with split(","),
You can check the CSV structure intuitively.
Check with Python
# No.054: Check the structure of the CSV file with raw strings
print(f"=== No.054: CSV Understand the structure of files ===")
print(f"file: {QUALITY_CSV}")
print()

with open(QUALITY_CSV, "r", encoding="utf-8") as f:
    all_lines = f.readlines()

total_rows = len(all_lines) - 1  # excluding header
print(f"Total number of lines: {len(all_lines)} row (header 1 rows + data {total_rows} line)")
print()

# Display first 5 lines as raw string
print("=== First 5 rows of raw data (comma separated structure) ===")
for i, line in enumerate(all_lines[:5]):
    print(f"  [{i}] {line.rstrip()}")

print()

# Split header and check column index
header_raw = all_lines[0].rstrip().split(",")
print("=== Check column index ===")
for i, col in enumerate(header_raw):
    print(f"  columns[{i}]: {col}")

print()

# Decompose and examine a single row of data
sample = all_lines[1].rstrip().split(",")
print("=== Result of decomposing one row of data into columns ===")
for col, val in zip(header_raw, sample):
    typ = "numerical value" if val.replace(".", "").replace("-", "").isdigit() else "string"
    print(f"  {col}: {val!r}  ({typ})")
=== No.054: Understanding the structure of CSV files === File: /var/folders/3y/fmw40k0x78xblvb3gkcyvy1h0000gn/T/kobo_quality_check.csv
Total number of lines: 306 lines (1 header line + 305 data lines)

=== First 5 rows of raw data (comma separated structure) ===
  [0] Date, line, product code, product name, production quantity, defective number, defect rate
  [1] 2025-01-06,A line,EG-1001,engine parts A,832,23,2.88
  [2] 2025-01-06,B line,EG-1002,Engine parts B,746,22,3.06
  [3] 2025-01-06,C line,HN-2001,harness unit,1133,22,2.03
  [4] 2025-01-06,D line,SN-3001,sensor module,882,29,3.35

=== Check column index ===
  Column[0]: Date
  Column[1]: Line
  Column [2]: Product code
  Column [3]: Product name
  Column [4]: Production quantity
  Column [5]: Number of defects
  Column [6]: Defect rate

=== Result of decomposing one row of data into columns ===
  Date: '2025-01-06' (number)
  Line: 'A line' (string)
  Product code: 'EG-1001' (string)
  Product name: 'Engine part A' (string)
  Production: '832' (number)
  Number of defects: '23' (number)
  Defect rate: '2.88' (number)
Reading the results
The total number of lines in the CSV file (1 header line + data line) has been confirmed.
You can understand the index structure where column [0] is “date” and column [6] is “defect rate”.
Note that all results of split(",") are of type string.
Both the production quantity (column [4]) and defect rate (column [6]) are strings such as '850' '1.22'.
Type conversion with csv.reader (No.055) and int() / float() (No.055~) is required.
No.055: Load CSV with csv module
Practical meaning
The csv module allows you to do things like "..." quoting for values containing commas.
It will be handled automatically.
Even if commas are included in the product name or memo field of manufacturing data, it can be parsed correctly.
Concept of analysis and modeling
csv.reader(f) creates an iterator from a file object,
Returns the rows as a list ['value1', 'value2', ...].
- Skip one header line with
next(reader) - Process each data row with
for row in reader:
Specifying newline='' as open() is the convention when using csv.reader.
Check with Python
# No.055: Read CSV with csv.reader
print("=== No.055: Load CSV with csv.reader ===")
print()

rows_055 = []
with open(QUALITY_CSV, "r", encoding="utf-8", newline="") as f:
    reader = csv.reader(f)
    header_055 = next(reader)  # Get header row (skip)
    for row in reader:
        rows_055.append(row)  # Store each row as a list

print(f"header  : {header_055}")
print(f"Number of data items: {len(rows_055):,} rows")
print()
print("=== First 5 lines (list read with csv.reader) ===")
fmt = f"  {{:<12}} {{:<10}} {{:<10}} {{:>8}} {{:>8}} {{:>8}}"
print(fmt.format(header_055[0], header_055[1], header_055[2], header_055[4], header_055[5], header_055[6]))
print("  " + "-" * 62)
for row in rows_055[:5]:
    print(fmt.format(row[0], row[1], row[2], row[4], row[5], row[6]))
print()

# Check header row type
print("=== csv.reader row type ===")
print(f"  header row type  : {type(header_055)}, element type: {type(header_055[0])}")
print(f"  data row type    : {type(rows_055[0])}, element type: {type(rows_055[0][4])!r} <- Even numbers can be strings!")
=== No.055: Load CSV with csv.reader ===
Header: ['Date', 'Line', 'Product code', 'Product name', 'Production quantity', 'Defect quantity', 'Defect rate']
Number of data: 305 lines

=== First 5 lines (list read with csv.reader) ===
  Date Line Product code Production quantity Number of defectives Defect rate
  --------------------------------------------------------------
  2025-01-06 A-line EG-1001 832 23 2.88
  2025-01-06 B line EG-1002 746 22 3.06
  2025-01-06 C line HN-2001 1133 22 2.03
  2025-01-06 D line SN-3001 882 29 3.35
  2025-01-06 E-line FR-4001 640 12 1.92

=== csv.reader row type ===
  Header row type: <class 'list'>, Element type: <class 'str'>
  Data row type: <class 'list'>, Element type: <class 'str'> <- Even numbers can be strings!
Reading the results
csv.reader was able to read header rows and data rows as lists.
An important point to note is that both the production quantity “850” and the defect rate “1.22” are returned as strings.
Explicit type conversion using int(row[4]) or float(row[6]) is required.
csv.reader automatically processes delimiters and quotes, so
split(",") A safer and more reliable way to read CSV.
No.056: Process CSV rows one by one
Practical meaning
To scan all 330 lines of the quality inspection CSV one by one and tally the defect rate alert**,
This is the core of automated quality check every morning. In the row-by-row processing loop for row in reader:,
There is no need to change the code even if the number of data items increases.
Concept of analysis and modeling
“Row-by-row processing” applies judgment and aggregation processing to each row of CSV.
- Count number of alerts: conditional
if+ counter variable - Filter data: only rows that meet the conditions are stored in a separate list
- Aggregation: Add numbers for each row (detailed in
No.058)
Check with Python
# No.056: Aggregate defect rate alerts by processing CSV rows one by one
print("=== No.056: Process CSV rows one by one ===")
print()

DEFECT_THRESHOLD_056 = 3.0  # Defect rate alert threshold (%)

alert_rows_056 = []
normal_count_056 = 0
alert_count_056 = 0

with open(QUALITY_CSV, "r", encoding="utf-8", newline="") as f:
    reader = csv.reader(f)
    next(reader)  # skip header
    for row in reader:
        rate_f = float(row[6])  # Column [6] = Defect rate (converted from string to float)
        if rate_f >= DEFECT_THRESHOLD_056:
            alert_rows_056.append(
                {
                    "date": row[0],
                    "line": row[1],
                    "Product code": row[2],
                    "Defect rate": rate_f,
                }
            )
            alert_count_056 += 1
        else:
            normal_count_056 += 1

total_056 = alert_count_056 + normal_count_056
print(f"All inspection records : {total_056:,} records")
print(f"normal (< {DEFECT_THRESHOLD_056}%)  : {normal_count_056:,} records")
print(f"alert (>= {DEFECT_THRESHOLD_056}%): {alert_count_056:,} records  ({alert_count_056/total_056*100:.1f}%)")
print()

# Number of alerts per line
line_alerts = defaultdict(int)
for r in alert_rows_056:
    line_alerts[r["line"]] += 1

print(f"=== Number of alerts by line (defect rate >= {DEFECT_THRESHOLD_056}% days)===")
print(f"{'line':<10} {'Number of alerts':>12} {'Overall ratio':>8}")
print("-" * 34)
for line_name in sorted(line_alerts.keys()):
    cnt = line_alerts[line_name]
    bdays_cnt = total_056 // len(lines_config)
    pct = cnt / bdays_cnt * 100
    print(f"{line_name:<10} {cnt:>12} records {pct:>7.1f}%")

print()
print(f"=== Defect rate TOP5 ===")
top5 = sorted(alert_rows_056, key=lambda x: x["Defect rate"], reverse=True)[:5]
for i, r in enumerate(top5, 1):
    print(f"  {i}rank: {r['date']} {r['line']} ({r['Product code']}): {r['Defect rate']:.2f}%")
=== No.056: Process CSV rows one by one ===
Total inspection records: 305
Normal (< 3.0%): 220 items
Alerts (>= 3.0%): 85 (27.9%)

=== Number of alerts by line (number of days with defect rate >= 3.0%) ===
Number of line alerts overall ratio
----------------------------------
A-line 1 item 1.6%
B line 25 items 41.0%
C line 44 cases 72.1%
D line 15 cases 24.6%

=== Defect rate TOP5 ===
  1st place: 2025-03-12 C line (HN-2001): 6.21%
  2nd place: 2025-02-17 C line (HN-2001): 6.13%
  3rd place: 2025-03-26 C line (HN-2001): 6.00%
  4th place: 2025-03-07 C line (HN-2001): 5.99%
  5th place: 2025-03-20 C line (HN-2001): 5.97%
Reading the results
As a result of scanning all lines of 305 inspection records, 220 normal cases and 85 alert cases (27.9%) were totaled.
C line (HN-2001: harness unit) has the highest alert frequency with 44 (72.1%).
The maximum defect rate was 6.21% for C line on 2025-03-12, which is about 2.5 times the normal rate.
The A line has only one alert, and the E line (FR-4001) is operating stably with zero alerts.
Type conversion by float(row[6]) and distribution by if rate_f >= DEFECT_THRESHOLD_056: are
This is a typical pattern for line-by-line CSV processing.
No.057: Extract specific columns from CSV
Practical meaning
Extract only “product code, production quantity, defect rate” instead of all columns**
A typical task in creating quality control reports is to compile the average production quantity and average defect rate for each product.
Defining column indexes as constants makes it easier to modify when columns are added or removed.
Concept of analysis and modeling
Retrieve a specific column with row[index].
Defining the column index as a constant variable (e.g. IDX_PROD = 4)
Even if the column order of CSV changes, it can be handled by making a change in one place.
By using defaultdict for aggregation, you can omit the dictionary initialization code.
Check with Python
# No.057: Extract specific columns from CSV and perform aggregation by product code

# Define the column index as a constant (even if the CSV column structure changes, you only need to modify it in one place)
IDX_DATE = 0
IDX_LINE = 1
IDX_CODE = 2
IDX_NAME = 3
IDX_PROD = 4
IDX_DEFECT = 5
IDX_RATE = 6

print("=== No.057: Extract specific columns from CSV ===")
print()

# Extract only 3 columns: product code, production quantity, defect rate
code_stats = defaultdict(lambda: {"Production number": 0, "Total defect rate": 0.0, "Number of cases": 0, "name": ""})

with open(QUALITY_CSV, "r", encoding="utf-8", newline="") as f:
    reader = csv.reader(f)
    next(reader)
    for row in reader:
        code = row[IDX_CODE]
        prod = int(row[IDX_PROD])  # Convert column[4] to int
        rate = float(row[IDX_RATE])  # Convert column [6] to float
        code_stats[code]["Production number"] += prod
        code_stats[code]["Total defect rate"] += rate
        code_stats[code]["Number of cases"] += 1
        code_stats[code]["name"] = row[IDX_NAME]

print("=== Cumulative production quantity/average defect rate by product code ===")
print(f"{'code':<10} {'Product name':<18} {'Cumulative production number':>12} {'Average defect rate':>10}")
print("-" * 56)
for code in sorted(code_stats.keys()):
    s = code_stats[code]
    avg = s["Total defect rate"] / s["Number of cases"]
    print(f"{code:<10} {s['name']:<18} {s['Production number']:>12,} units {avg:>9.2f}%")
=== No.057: Extract specific columns from CSV ===
=== Cumulative production quantity/average defect rate by product code ===
Code Product name Cumulative production quantity Average defect rate
--------------------------------------------------------
EG-1001 Engine parts A 51,690 pieces 1.96%
EG-1002 Engine parts B 43,727 pieces 2.78%
FR-4001 Frame parts 38,546 pieces 1.37%
HN-2001 Harness unit 73,157 pieces 3.89%
SN-3001 sensor module 57,698 pieces 2.22%
Reading the results
For each of the five product codes, the cumulative production quantity and average defect rate for three months were compiled.
By making the column index constant like IDX_PROD = 4,
Improves maintainability when the CSV format changes.
defaultdict(lambda: {...}) is a practical technique that allows you to skip the dictionary initialization process.
The average defect rate is expected to be the highest for HN-2001 (harness unit),
Helps identify priority management lines.
No.058: Sum the numerical columns of CSV
Practical meaning
Directly summarizing the cumulative production and defective numbers for each line from CSV is as follows:
This process is directly linked to the automatic generation of monthly quality reports.
By visualizing the aggregated results in a graph, you can intuitively understand which line is the most risky.
Concept of analysis and modeling
The basic pattern for summing CSV numerical columns is
Simple cumulative addition of total += int(row[i]).
- Don’t forget type conversion using
int()/float() - Use a dictionary for line-by-line aggregation (
line_totals[line]["Production number"] += prod)
Check with Python
# No.058: Total the CSV numerical columns (production quantity/defective quantity) for each line
print("=== No.058: Sum the numerical columns of CSV ===")
print()

total_prod = 0
total_defect = 0
line_totals = {}

with open(QUALITY_CSV, "r", encoding="utf-8", newline="") as f:
    reader = csv.reader(f)
    next(reader)
    for row in reader:
        prod = int(row[IDX_PROD])
        defect = int(row[IDX_DEFECT])
        line = row[IDX_LINE]
        total_prod += prod
        total_defect += defect
        if line not in line_totals:
            line_totals[line] = {"Production number": 0, "Number of defects": 0, "code": row[IDX_CODE], "name": row[IDX_NAME]}
        line_totals[line]["Production number"] += prod
        line_totals[line]["Number of defects"] += defect

overall_rate = total_defect / total_prod * 100

print("=== Cumulative production by line (January to March 2025) ===")
print(f"{'line':<10} {'Total production quantity':>12} {'Total number of defects':>10} {'Defect rate':>8}")
print("-" * 46)
for line in sorted(line_totals.keys()):
    t = line_totals[line]
    rate = t["Number of defects"] / t["Production number"] * 100
    print(f"{line:<10} {t['Production number']:>12,} units {t['Number of defects']:>8} units {rate:>7.2f}%")
print("-" * 46)
print(f"{'Total of all lines':<10} {total_prod:>12,} units {total_defect:>8} units {overall_rate:>7.2f}%")
=== No.058: Sum the numerical columns of CSV ===
=== Cumulative production by line (January to March 2025) ===
Line Total number of production Total number of defects Defect rate
----------------------------------------------
A-line 51,690 pieces 978 pieces 1.89%
B line 43,727 pieces 1185 pieces 2.71%
C line 73,157 pieces 2817 pieces 3.85%
D line 57,698 pieces 1253 pieces 2.17%
E line 38,546 pieces 497 pieces 1.29%
----------------------------------------------
Total for all lines 264,818 pieces 6730 pieces 2.54%
# No.058: Visualization of production quantity and defect rate by line
sorted_lines = sorted(line_totals.keys())
prods = [line_totals[l]["Production number"] for l in sorted_lines]
defects = [line_totals[l]["Number of defects"] for l in sorted_lines]
rates = [line_totals[l]["Number of defects"] / line_totals[l]["Production number"] * 100 for l in sorted_lines]
fig, axes = plt.subplots(1, 2, figsize=(13, 5))
x_pos = list(range(len(sorted_lines)))
# Left: Production quantity (accumulation: number of good items + number of defective items)
good_counts = [p - d for p, d in zip(prods, defects)]
axes[0].bar(x_pos, [g / 1000 for g in good_counts], color="#2E86AB", alpha=0.85, label="Number of good products")
axes[0].bar(
x_pos,
[d / 1000 for d in defects],
color="#E74C3C",
alpha=0.85,
label="Number of defects",
bottom=[g / 1000 for g in good_counts],
)
for i, p in enumerate(prods):
axes[0].text(i, p / 1000 + 0.5, f"{p/1000:.1f}k", ha="center", va="bottom", fontsize=9)
axes[0].set_title("Cumulative production volume for 3 months by line (breakdown of good/defective products)", fontsize=13, pad=10)
axes[0].set_xlabel("line", fontsize=11)
axes[0].set_ylabel("Production quantity (thousands)", fontsize=11)
axes[0].set_xticks(x_pos)
axes[0].set_xticklabels(sorted_lines, fontsize=10)
axes[0].legend(fontsize=10)
axes[0].grid(axis="y", alpha=0.3)
# Right: Defect rate (bar graph + threshold line)
bar_colors = ["#E74C3C" if r >= 3.0 else "#2E86AB" for r in rates]
axes[1].bar(x_pos, rates, color=bar_colors, alpha=0.85)
axes[1].axhline(y=3.0, color="red", linewidth=2.0, linestyle="--", label="Warning line (3.0%)")
axes[1].axhline(y=overall_rate, color="gray", linewidth=1.5, linestyle=":", label=f"overall average ({overall_rate:.2f}%)")
for i, r in enumerate(rates):
axes[1].text(i, r + 0.05, f"{r:.2f}%", ha="center", va="bottom", fontsize=9)
axes[1].set_title("3-month average defect rate by line", fontsize=13, pad=10)
axes[1].set_xlabel("line", fontsize=11)
axes[1].set_ylabel("Defect rate (%)", fontsize=11)
axes[1].set_xticks(x_pos)
axes[1].set_xticklabels(sorted_lines, fontsize=10)
axes[1].legend(fontsize=9)
axes[1].grid(axis="y", alpha=0.3)
plt.tight_layout()
plt.show()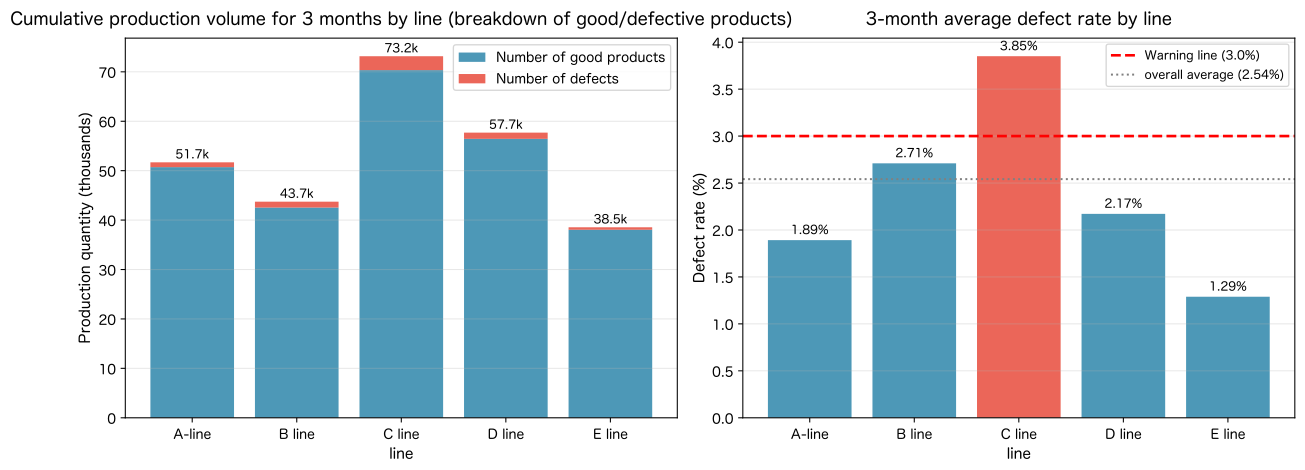
Reading the results
As a result of aggregating all rows of CSV for 3 months (61 business days x 5 lines = 305 records),
Total of all lines was 264,818 pieces, overall defect rate was 2.54%.
The C line (HN-2001) defect rate 3.85% is the only one that exceeds the 3.0% threshold and is visualized by the red bar.
E line (FR-4001) has the most stable defect rate of 1.29%.
In the stacked bar on the left graph, you can see that the C line, which is planned to produce 1,200 pieces/day, has the largest overall production volume (73,157 pieces).
The basic form of CSV numerical processing is aggregation by line using the type conversion pattern int(row[IDX_PROD]) and a dictionary.
No.059: Export processing results to CSV
Practical meaning
By exporting the aggregation results to a new CSV file,
It is possible to link with other tools (Excel, BI system, ERP).
“Posting of summary tables”, which used to be done manually, can be completely automated using code.
Concept of analysis and modeling
Generate a writer object with csv.writer(f),
writer.writerow([value1, value2, ...])— write one linewriter.writerows([[...], [...], ...])— Write multiple lines at once
The basic pattern is to start the header line with writerow followed by the data line.
Specifying open(..., newline='') prevents blank line insertion in Windows environments.
Check with Python
# No.059: Export aggregation results to CSV file
print("=== No.059: Export processing results to CSV ===")
print()

with open(SUMMARY_CSV, "w", newline="", encoding="utf-8") as f:
    writer = csv.writer(f)

    # header row
    writer.writerow(["line", "Product code", "Product name", "Total production quantity", "Total number of defects", "Defect rate", "Total number of non-defective products"])

    # Data rows (by line)
    for line in sorted(line_totals.keys()):
        t = line_totals[line]
        rate = round(t["Number of defects"] / t["Production number"] * 100, 2)
        good = t["Production number"] - t["Number of defects"]
        writer.writerow([line, t["code"], t["name"], t["Production number"], t["Number of defects"], rate, good])

    # total line
    writer.writerow(
        ["Total of all lines", "", "", total_prod, total_defect, round(overall_rate, 2), total_prod - total_defect]
    )

print(f"Writing completed: {SUMMARY_CSV}")
print()

# Load and check the exported CSV
print("=== Contents of exported CSV (check with csv.reader) ===")
with open(SUMMARY_CSV, "r", encoding="utf-8", newline="") as f:
    reader = csv.reader(f)
    for i, row in enumerate(reader):
        prefix = "header" if i == 0 else f"rows [{i:>2}]"
        print(f"  {prefix}: {row}")
=== No.059: Export processing results to CSV ===
Writing completed: /var/folders/3y/fmw40k0x78xblvb3gkcyvy1h0000gn/T/kobo_quality_summary.csv

=== Contents of exported CSV (check with csv.reader) ===
  Header: ['Line', 'Product code', 'Product name', 'Total production quantity', 'Total number of defects', 'Defect rate', 'Total number of non-defective parts']
  Line [ 1]: ['A line', 'EG-1001', 'Engine part A', '51690', '978', '1.89', '50712']
  Line [ 2]: ['B line', 'EG-1002', 'Engine part B', '43727', '1185', '2.71', '42542']
  Line [ 3]: ['C line', 'HN-2001', 'Harness unit', '73157', '2817', '3.85', '70340']
  Line [ 4]: ['D-Line', 'SN-3001', 'Sensor Module', '57698', '1253', '2.17', '56445']
  Line [ 5]: ['E line', 'FR-4001', 'Frame parts', '38546', '497', '1.29', '38049']
  Line [ 6]: ['Total of all lines', '', '', '264818', '6730', '2.54', '258088']
Reading the results
With csv.writer, a total of 7 lines, including the header line, 5 lines of data lines, and the overall total line, were exported to the CSV file.
By reading the exported CSV again with csv.reader,
You can confirm that the header and data are correctly structured as a list.
Since the argument of writer.writerow() is a list,
Simply arrange the values in each column in the format [line, t["code"], ...] to complete the CSV.
This output CSV can be opened directly in Excel for checking and sharing.
No.060: Aggregate monthly sales from sales CSV
Practical meaning
To aggregate sales by month and product and create a graph from the sales CSV,
This is the core work of monthly management reports and product line management.
csv.DictReader allows access by column name, so
You can write easy-to-read code without worrying about column indexes.
Concept of analysis and modeling
csv.DictReader(f) returns each row as a dictionary of {Column name: value}.
It is highly readable because it can be accessed directly by column name, such as row["amount"].
It is not affected by changing the CSV column order.
For monthly aggregation, row["date"][:7] extracts the month key in "2025-01" format and aggregates it in a dictionary.
Check with Python
# No.060: Aggregate sales by month and product from sales CSV (csv.DictReader)
print("=== No.060: Aggregate monthly sales from sales CSV ===")
print()

monthly_amounts = defaultdict(int)  # {month key: total amount}
monthly_qty = defaultdict(int)  # {month key: total quantity}
code_monthly_060 = defaultdict(lambda: defaultdict(int))  # {Product code: {Month key: Total amount}}

with open(SALES_CSV, "r", encoding="utf-8", newline="") as f:
    reader = csv.DictReader(f)  # directly accessible by column name
    for row in reader:
        month_key = row["date"][:7]  # "2025-01-06" -> "2025-01"
        amount = int(row["amount"])
        qty = int(row["quantity"])
        code = row["Product code"]
        monthly_amounts[month_key] += amount
        monthly_qty[month_key] += qty
        code_monthly_060[code][month_key] += amount

months_060 = sorted(monthly_amounts.keys())

print("=== Monthly sales summary ===")
print(f"{'moon':<10} {'Sales amount':>16} {'Total quantity':>10}")
print("-" * 40)
for m in months_060:
    print(f"{m:<10} {monthly_amounts[m]:>16,} JPY {monthly_qty[m]:>8,} units")
print("-" * 40)
grand_total_060 = sum(monthly_amounts.values())
print(f"{'3 months total':<10} {grand_total_060:>16,} JPY")

print()

# Monthly sales by product code
product_codes_060 = sorted(code_monthly_060.keys())
pname_map = {lc["code"]: lc["name"] for lc in lines_config}
print("=== Monthly sales by product code ===")
header_row = f"{'Product code':<10} {'Product name':<18}" + "".join(f" {m:>14}" for m in months_060) + "total"
print(header_row)
print("-" * (len(header_row) + 4))
for code in product_codes_060:
    row_vals = [code_monthly_060[code].get(m, 0) for m in months_060]
    row_str = f"{code:<10} {pname_map.get(code,''):<18}"
    for v in row_vals:
        row_str += f" {v:>12,}JPY"
    row_str += f" {sum(row_vals):>12,}JPY"
    print(row_str)
=== No.060: Aggregate monthly sales from sales CSV ===
=== Monthly sales summary ===
Month Sales amount Total quantity
----------------------------------------
2025-01 279,739,400 yen 85,438 pieces
2025-02 287,619,600 yen 88,148 pieces
2025-03 293,686,100 yen 89,661 pieces
----------------------------------------
3 months total 861,045,100 yen

=== Monthly sales by product code ===
Product code Product name 2025-01 2025-02 2025-03 Total
--------------------------------------------------------------------------------------------
EG-1001 Engine parts A 70,606,200 yen 73,323,600 yen 73,806,600 yen 217,736,400 yen
EG-1002 Engine parts B 53,751,000 yen 55,567,400 yen 56,886,000 yen 166,204,400 yen
FR-4001 Frame parts 67,919,500 yen 68,442,000 yen 71,230,500 yen 207,592,000 yen
HN-2001 Harness unit 35,203,500 yen 36,759,000 yen 36,813,000 yen 108,775,500 yen
SN-3001 Sensor module 52,259,200 yen 53,527,600 yen 54,950,000 yen 160,736,800 yen
# No.060: Monthly sales graph
colors_060 = ["#2E86AB", "#A23B72", "#F18F01", "#C73E1D", "#44BBA4"]
fig, axes = plt.subplots(1, 2, figsize=(13, 5))
x_pos_060 = list(range(len(months_060)))
# Left: Monthly total sales (bar graph)
month_amounts_million = [monthly_amounts[m] / 10_000 for m in months_060]
bars_060 = axes[0].bar(x_pos_060, month_amounts_million, color=["#2E86AB", "#A23B72", "#F18F01"], alpha=0.82, width=0.5)
for bar, val in zip(bars_060, month_amounts_million):
axes[0].text(
bar.get_x() + bar.get_width() / 2,
bar.get_height() + 30,
f"{val:,.0f}million",
ha="center",
va="bottom",
fontsize=10,
fontweight="bold",
)
axes[0].set_title("Monthly total sales", fontsize=13, pad=10)
axes[0].set_xlabel("moon", fontsize=11)
axes[0].set_ylabel("Sales amount (10,000 yen)", fontsize=11)
axes[0].set_xticks(x_pos_060)
axes[0].set_xticklabels(months_060, fontsize=10)
axes[0].yaxis.set_major_formatter(ticker.FuncFormatter(lambda v, _: f"{v:,.0f}"))
axes[0].grid(axis="y", alpha=0.3)
# Right: Monthly sales by product (stacked bar graph)
bottom_060 = [0.0] * len(months_060)
for i, code in enumerate(product_codes_060):
vals = [code_monthly_060[code].get(m, 0) / 10_000 for m in months_060]
axes[1].bar(x_pos_060, vals, bottom=bottom_060, color=colors_060[i], alpha=0.85, label=pname_map.get(code, code))
bottom_060 = [b + v for b, v in zip(bottom_060, vals)]
axes[1].set_title("Monthly sales by product (cumulative)", fontsize=13, pad=10)
axes[1].set_xlabel("moon", fontsize=11)
axes[1].set_ylabel("Sales amount (10,000 yen)", fontsize=11)
axes[1].set_xticks(x_pos_060)
axes[1].set_xticklabels(months_060, fontsize=10)
axes[1].yaxis.set_major_formatter(ticker.FuncFormatter(lambda v, _: f"{v:,.0f}"))
axes[1].legend(fontsize=9, loc="upper left")
axes[1].grid(axis="y", alpha=0.3)
plt.tight_layout()
plt.show()findfont: Failed to find font weight bold, now using 400.
Reading the results
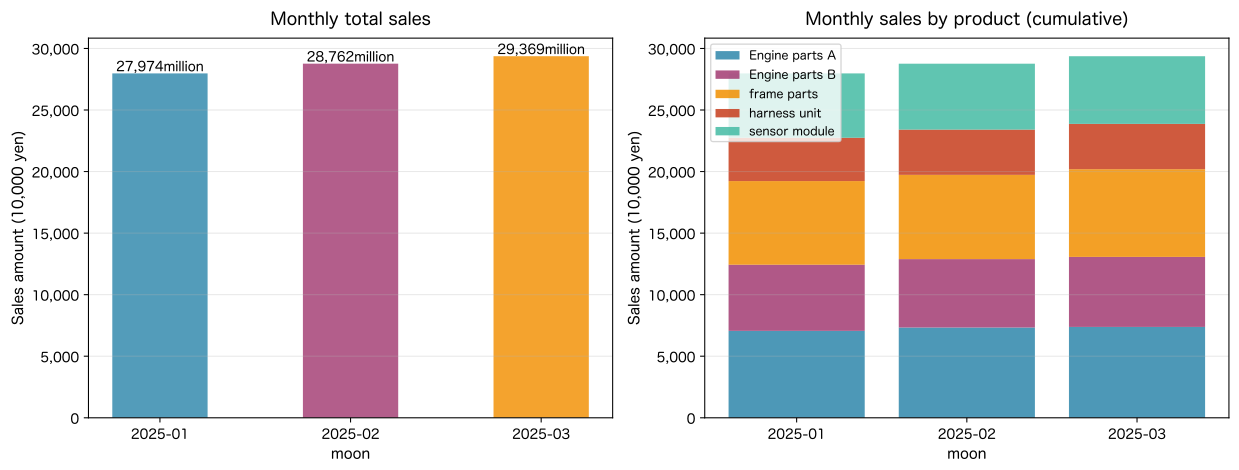
Sales by month and product code were aggregated from the 3-month sales CSV.
Total monthly sales were January 279,739,400 yen → February 287,619,600 yen → March 293,686,100 yen
It has been increasing slowly, and the total for the three months is 861,045,100 yen.
By product, Engine part A (EG-1001) is the largest at 217,736,400 yen;
In the stacked graph, frame parts (FR-4001: unit price 5,500 yen) have a high unit price and occupy a large area.
Column name access row["amount"] of csv.DictReader
The pattern of creating monthly keys by slicing with row["date"][:7] is a standard technique for monthly aggregation.
Practical implications seen through target exerciseing
The file operations and CSV processing learned in No.051-060 are the input/output foundation of manufacturing data analysis.
1. Always use with statement
with open(...) as f: is not just about style, it’s about security.
This prevents file locking if you forget to write f.close() and handle leakage in the event of an exception.
Do not use the with statement in production data processing. Make it a habit not to write the open() statement.
2. Be aware that CSV values are of string type
All values returned by csv.reader are strings.
If you forget to convert int(row[4]) or float(row[6]),
A calculation error '850' + '720' = '850720' (string concatenation) occurs.
To deal with conversion errors, combine the patterns learned in Chapter 5 (No.049 try-except).
3. Make column index constant
With the constant definition IDX_PROD = 4, even if the column structure of CSV changes
Only one place needs to be corrected.
Furthermore, if you use csv.DictReader, you can access by column name, increasing maintainability.
4. Pass the aggregation results to the next process with csv.writer
By exporting the results aggregated with Python to CSV,
Can be linked with Excel, BI tools, and ERP.
The flow is “Tally with Python → Export with CSV → Check with Excel”
This is the first step in promoting DX at manufacturing sites.
What you need to implement in practice
Step 1: Confirm the format of existing CSV (about half a day)
CSV output from on-site inspection terminals and ERP Check “character code, column structure, delimiter, date format”.
| Items to check | Common problems | Solutions |
|---|---|---|
| Character code | Output in Shift-JIS | Specify encoding='cp932' |
| Delimiter | For tab delimited (TSV) | csv.reader(f, delimiter='\t') |
| Date format | 20250106 (8-digit integer) format | Convert with datetime.strptime(d, '%Y%m%d') |
| Comma in number | Number in format '1,200' | int(row[4].replace(',', '')) |
Step 2: Read → Aggregation → Build the export pipeline (about 1 day)
Load CSV with open()
  → Process line by line with csv.reader / DictReader
  → Conditional branching/aggregation (Chapter 4/Chapter 5 skills)
  → Export aggregation results using csv.writer
Step 3: Automate regular execution (about half a day)
With cron (Linux/macOS) or task scheduler (Windows)
The script runs regularly and CSV aggregation is automated every day.
When combined with the datetime module in Chapter 5 (No.046-050)
You can implement the process of “loading CSV from a folder with today’s date”.
Step 4: Decision to move to Chapter 8 (Polars)
If the CSV contains hundreds of thousands of rows or more, or if complex aggregation is required,
Consider migrating Polars to read_csv() / group_by(), which you will learn about in Chapter 8.
The csv module in this chapter is a Python standard library that has no dependencies and is suitable for small scale.
Polars is used for high-speed and large-scale data.
Summary
We will summarize what we learned in this chapter (No.051-060).
| No. | Skills | Utilization at manufacturing sites |
|---|---|---|
| 051 | Load file | Load production daily report text with open() |
| 052 | Write to file | Export quality alert report to text file |
| 053 | Handle files safely with the with statement | Read and write line summary summaries safely with with open() |
| 054 | Understanding the structure of CSV files | Quality inspection Check the column structure and data type of CSV with raw strings |
| 055 | Load CSV with csv module | Read header data properly with csv.reader |
| 056 | Process CSV rows one by one | Summarize the number of defect rate alerts by scanning all rows |
| 057 | Extract specific columns from CSV | Extract product code and production number using column index constant |
| 058 | Totaling CSV numerical columns | Aggregating and visualizing cumulative production and defective numbers by line |
| 059 | Export processing results to CSV | Export summary summary using csv.writer |
| 060 | Aggregating monthly sales from sales CSV | Aggregating and graphing sales by month and product using DictReader |
Chapter 7 uses NumPy to perform the CSV aggregation process in this chapter.
Learn how to speed up array operations.
Functions such as np.sum() / np.mean() are better than for loops.
Aggregation of large amounts of data can be written quickly and concisely.
Consultation for corporations
Surikobo provides Python training and data analysis support for manufacturing industry and DX promotion staff.
Do you have any of these problems?
- “I want to automatically aggregate CSV output from inspection terminals/ERP using Python”
- “I want to automatically generate quality reports that are manually copied and pasted every day.”
- “I want to link the results compiled using Python with Excel/BI system”
- “I would like you to create a customized Python training program for your company.”
Services provided
| Service | Overview |
|---|---|
| Python training for the manufacturing industry | Practical training using field data (online/face-to-face) |
| CSV automatic aggregation system construction | Automatic aggregation and report generation of inspection CSV and sales CSV |
| Quality control automation support | Defect rate alert/quality report automation |
| DX promotion consulting | Consistent support from problem organization to implementation |
📩 Contact: surikobo.co.jp/contact Please feel free to contact us first.