
100 Exercises / System Development / 100 Exercise on System Development
Introduction to System Development in Manufacturing | Learning Web, API, and DB Design with Equipment Maintenance Apps
Introduction to Designing a Maintenance Request Management System to Reduce Equipment Downtime
100 Exercise “System Development” No.001–No.010
This article focuses on business challenges in manufacturing and offers a practical approach that helps you understand the overall picture of system development step by step with 10 exercises. The subjects are Management of equipment shutdown and maintenance requests spread across paper, telephone, and spreadsheet files. It connects the system’s purpose, web application structure, HTTP/API, requirements definition, consistency between designs, business flow, and overall structure all within a single hypothetical case.
Across the entire 100-click phase, we will move on to development environments, databases, APIs, frontends, authentication, testing, CI/CD, business functions, and AI and data utilization. For the first 10 articles, we create a “map” to avoid confusion in subsequent implementations. What matters is not simply introducing the technology itself, but how to improve on-site decision-making speed, record quality, and downtime losses.
[!NOTE] This material is a notebook previously used by Surikoubo (or personally by the representative, Kazuyama), and has been reconstructed, edited, and published with the company’s permission.
All data listed is fictional and has no relation whatsoever to real companies, factories, or figures.
1. Introduction: Practical Challenges in Manufacturing Covered in This Article
In the fictional ‘Suri Seiki Factory,’ workers who discover equipment abnormalities contact the team leader, who then calls the maintenance staff. The details of the procedures are later transcribed into paper daily reports and spreadsheet files. While the response capability for emergency cases is high, records of reception, assignment, and recovery times are not aligned, so even at the end of the month, it is impossible to compare which equipment should be prioritized for preventive maintenance.
The business objectives of the business app being developed here are set as follows.
- Shorten the waiting time from anomaly detection to conservation initiation
- Monitor unsupported, in progress, and completed on a single screen
- Accumulate downtime and causes by equipment to use as a basis for decision-making in maintenance investment.
- Minimize the operation that allows the site to continue entering data
System development is not just about creating screens. This activity involves verbalizing business rules, aligning the meaning of data, and transforming it into a system that allows stakeholders to view the same state and make judgments.
2. Common Situations on Site
Information about equipment abnormalities tends to be scattered across verbal, extension, chat, paper daily reports, and personal spreadsheet files. As a result, duplicate registrations of the same case, misunderstandings among responsible persons, and missed records after restoration occur. Administrators recollect data with each monthly report, and the preliminary and final values do not match.
What’s especially difficult is that the faster the first aid on site, the more likely it is to ‘record later.’ If you add too many input items, they won’t be used; if you reduce them too much, they can’t be used for improvement analysis. Therefore, it is necessary to simultaneously consider business workflows, screens, APIs, and databases.
3. Why is this issue difficult to judge?
Systematizing equipment maintenance involves competing decisions.
- Immediacy and accuracy: While registering with fewer items immediately after discovery, you also want to leave detailed information about the cause and treatment.
- Standardization and exception handling: Standard flows are necessary, but there are exceptions for emergency safety stops or outsourced repairs.
- On-site Optimization and Overall Optimization: A code structure that respects the unique naming of each line while enabling cross-factory comparisons is necessary.
- Short-term development and future expansion: While we want to start small, we also want to integrate sensors, inventory, and predictive maintenance in the future.
Therefore, rather than creating a large list of features from the start, clarify the minimum data required for decision-making and the division of business responsibilities before moving them into technology.
4. The overall picture of exercise covered this time
| No. | Theme | Questions Answered in This Case |
|---|---|---|
| 001 | What is system development? | What to decide, and in what order? |
| 002 | Business Systems and Web Apps | How to distinguish between business purpose and delivery method |
| 003 | Front Back: DB | What is each layer responsible for? |
| 004 | Client/Server | How do devices and servers coordinate |
| 005 | HTTP | What are the units of data exchange? |
| 006 | API | How to define the function window |
| 007 | Requirements definition | What to agree on before development |
| 008 | Screen, API, and database design | How to prevent omissions in design |
| 009 | Business Flow | How to extract functions from on-site movements |
| 010 | Small-scale app design | How to consolidate all elements into a single structure |
In each exercise, we use the fictional data generated by fixed seeds, replacing concepts with tables, aggregates, graphs, and simple simulations.
5. Preparing the Python environment
It does not connect to external data or services. numpy, pandas, and matplotlib are used, and japanize_matplotlib is used to display Japanese labels. Fix the random seed to 42 so that rerunning it yields the same result.
from dataclasses import dataclass, asdict
from datetime import datetime, timedelta
import json
import platform
from urllib.parse import urlencode

import numpy as np
import pandas as pd
import matplotlib
import matplotlib.pyplot as plt
import japanize_matplotlib
from IPython.display import display

SEED = 42
rng = np.random.default_rng(SEED)
pd.set_option("display.max_columns", 20)
pd.set_option("display.width", 120)
plt.rcParams["figure.figsize"] = (8, 4.5)

print("Python     :", platform.python_version())
print("numpy      :", np.__version__)
print("pandas     :", pd.__version__)
print("matplotlib :", matplotlib.__version__)
print("random seed:", SEED)
Python : 3.11.9
numpy : 1.26.4
pandas : 2.2.2
matplotlib : 3.9.2
random seed: 426. Creation of Fictional Data
Generate 120 maintenance requests for 3 lines and 8 facilities. reported_at indicates the time of abnormality detection and reception, started_at is the time maintenance began, and closed_at is the time restoration or completion. The key KPIs are as follows.
Downtime loss is calculated as a simple indicator for comparison, based on downtime time and marginal profit per minute for each piece of equipment. During actual implementation, production planning, work-in-progress, alternative equipment, and quality loss must also be considered.
equipment = pd.DataFrame({
    "equipment_id": [f"EQ-{i:03d}" for i in range(1, 9)],
    "equipment_name": ["Press1", "Press2", "lathe1", "lathe2", "grinding1", "Cleaning1", "Examination1", "transport1"],
    "line": ["A", "A", "B", "B", "B", "C", "C", "C"],
    "loss_yen_per_min": [12000, 10000, 8000, 7500, 9000, 5000, 6500, 4000],
})

n = 120
reported = pd.Timestamp("2026-04-01 08:00") + pd.to_timedelta(
    np.sort(rng.integers(0, 60 * 24 * 60, n)), unit="m"
)
priority = rng.choice(["high", "middle", "low"], n, p=[0.22, 0.50, 0.28])
wait_base = np.select([priority == "high", priority == "middle"], [12, 28], default=55)
initial_response = np.maximum(2, rng.gamma(shape=2.0, scale=wait_base / 2))
repair_time = rng.gamma(shape=2.2, scale=28, size=n) + np.where(priority == "high", 25, 0)

requests = pd.DataFrame({
    "request_id": [f"MR-{i:04d}" for i in range(1, n + 1)],
    "equipment_id": rng.choice(equipment["equipment_id"], n, p=[.16, .13, .14, .12, .13, .10, .12, .10]),
    "reported_at": reported,
    "priority": priority,
    "cause_category": rng.choice(["wear", "Adjustment Misalignment", "Electrical Systems", "foreign object", "Unknown"], n, p=[.28, .24, .18, .16, .14]),
    "report_channel": rng.choice(["telephone", "paper", "Chat"], n, p=[.45, .30, .25]),
})
requests["started_at"] = requests["reported_at"] + pd.to_timedelta(initial_response, unit="m")
requests["closed_at"] = requests["started_at"] + pd.to_timedelta(repair_time, unit="m")
requests["status"] = "Finished"
requests = requests.merge(equipment, on="equipment_id", how="left")
requests["response_min"] = (requests["started_at"] - requests["reported_at"]).dt.total_seconds() / 60
requests["downtime_min"] = (requests["closed_at"] - requests["reported_at"]).dt.total_seconds() / 60
requests["estimated_loss_yen"] = requests["downtime_min"] * requests["loss_yen_per_min"]

print(f"Conservation Request: {len(requests)}records / Eligible Facilities: {requests['equipment_id'].nunique()}platform")
display(requests.head().round({"response_min": 1, "downtime_min": 1, "estimated_loss_yen": 0}))
Conservation requests: 120 / Target equipment: 8| request_id | equipment_id | reported_at | priority | cause_category | report_channel | started_at | closed_at | status | equipment_name | line | loss_yen_per_min | response_min | downtime_min | estimated_loss_yen | |
|---|---|---|---|---|---|---|---|---|---|---|---|---|---|---|---|
| 0 | MR-0001 | EQ-006 | 2026-04-01 18:36:00 | middle | wear | Chat | 2026-04-01 19:02:20.766500160 | 2026-04-01 20:28:50.649064020 | Finished | Cleaning1 | C | 5000 | 26.3 | 112.8 | 564221.0 |
| 1 | MR-0002 | EQ-005 | 2026-04-03 13:39:00 | middle | wear | Chat | 2026-04-03 14:07:53.397734982 | 2026-04-03 15:08:05.648771814 | Finished | grinding1 | B | 9000 | 28.9 | 89.1 | 801847.0 |
| 2 | MR-0003 | EQ-003 | 2026-04-03 23:04:00 | middle | Adjustment Misalignment | Chat | 2026-04-03 23:31:31.636614581 | 2026-04-04 01:32:48.822951995 | Finished | lathe1 | B | 8000 | 27.5 | 148.8 | 1190510.0 |
| 3 | MR-0004 | EQ-008 | 2026-04-05 03:53:00 | low | wear | telephone | 2026-04-05 05:30:23.773472670 | 2026-04-05 05:58:24.436947378 | Finished | transport1 | C | 4000 | 97.4 | 125.4 | 501629.0 |
| 4 | MR-0005 | EQ-004 | 2026-04-05 09:48:00 | middle | wear | telephone | 2026-04-05 10:51:33.109732547 | 2026-04-05 11:40:09.319322723 | Finished | lathe2 | B | 7500 | 63.6 | 112.2 | 841165.0 |
7. No.001: Organizing What System Development Is
Meaning in Practice
System development is not just about replacing on-site challenges with software. It is an activity that defines “who decides what, when, and what,” and integrates the necessary tasks, data, operations, and operations. In this case, the goal is not to “increase the number of registrations,” but to reduce initial response time and downtime losses.
Approach to Analysis and Modeling
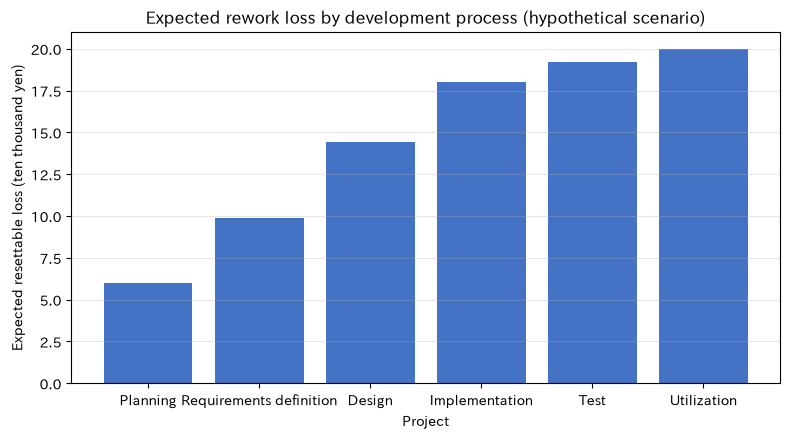
The probability of rework and impact vary at each stage—planning, requirements definition, design, implementation, testing, and operation. Simply put, the expected reversal loss at stage
Let’s say so. is the probability of misunderstandings in requirements, and is the cost of corrections if they are discovered later in the process. The numbers themselves are fictional, but they can visualize why time is being used for early agreements.
Check with Python
development_phases = pd.DataFrame({
    "Project": ["Planning", "Requirements definition", "Design", "Implementation", "Test", "Utilization"],
    "Main Deliverables": ["Purpose/KPI", "Business and Functional Requirements", "Screen/API/DBDesign", "Functional Functions", "Quality Inspection", "Monitoring and Improvement"],
    "Misunderstanding Residual Probability": [0.30, 0.22, 0.16, 0.10, 0.06, 0.04],
    "cost_of_correction_upon_discovery_ten_thousand_yen": [20, 45, 90, 180, 320, 500],
})
development_phases["expected_rework_loss_ten_thousand_yen"] = (
    development_phases["Misunderstanding Residual Probability"] * development_phases["cost_of_correction_upon_discovery_ten_thousand_yen"]
)
display(development_phases.round(1))

fig, ax = plt.subplots()
ax.bar(development_phases["Project"], development_phases["expected_rework_loss_ten_thousand_yen"], color="#4472C4")
ax.set_title("Expected rework loss by development process (hypothetical scenario)")
ax.set_xlabel("Project")
ax.set_ylabel("Expected resettable loss (ten thousand yen)")
ax.grid(axis="y", alpha=0.3)
plt.tight_layout()
plt.show()| Project | Main Deliverables | Misunderstanding Residual Probability | cost_of_correction_upon_discovery_ten_thousand_yen | expected_rework_loss_ten_thousand_yen | |
|---|---|---|---|---|---|
| 0 | Planning | Purpose/KPI | 0.3 | 20 | 6.0 |
| 1 | Requirements definition | Business and Functional Requirements | 0.2 | 45 | 9.9 |
| 2 | Design | Screen/API/DBDesign | 0.2 | 90 | 14.4 |
| 3 | Implementation | Functional Functions | 0.1 | 180 | 18.0 |
| 4 | Test | Quality Inspection | 0.1 | 320 | 19.2 |
| 5 | Utilization | Monitoring and Improvement | 0.0 | 500 | 20.0 |
Reading the results
Even if the probability of misunderstanding remains, the range of changes for subsequent processes expands, resulting in greater expected losses. Therefore, it is worth checking the equipment name, priority, completion conditions, and KPI definitions with the site, maintenance, and managers before implementation. Rather than prolonging requirements definition, it is practical to eliminate them in short cycles due to ambiguity that causes significant losses.
8. No.002: Understanding the Differences Between Business Systems and Web Applications
Meaning in Practice
“Business Systems” are classified by Business Objectives such as receiving maintenance requests, assigning responsibilities, and managing historical records. “Web applications” are classified based on Delivery Methods that use browsers and web technologies. The two are not opposing concepts; they can provide a business system called maintenance request management as a web application.
Approach to Analysis and Modeling
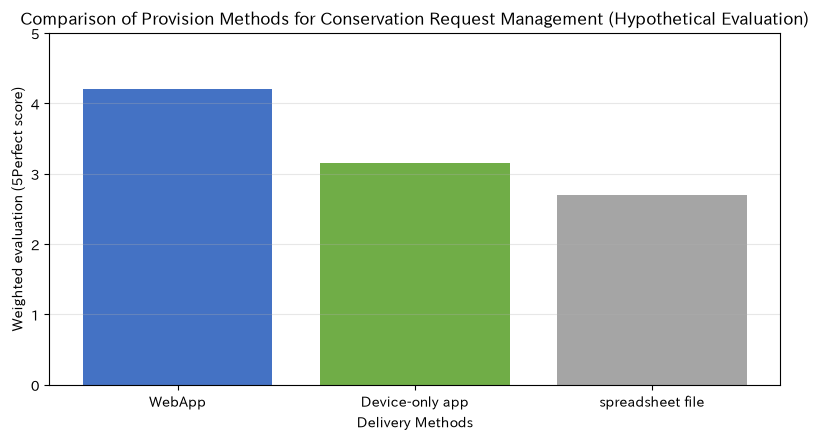
The delivery method compares multiple criteria such as site suitability, ease of updates, offline resistance, device function integration, and implementation costs. Here, a provisional evaluation out of 5 points and a weighting are used, and the weighted evaluation of Method
Calculate it as follows. The evaluation value is a hypothetical value used to indicate the selection process, but in reality, it reflects the factory’s communication environment and security standards.
Check with Python
delivery_options = pd.DataFrame({
    "Evaluation Axis": ["Multi-device support", "ease of updating", "Offline Tolerance", "Camera Integration", "Lightness of initial implementation"],
    "weight": [0.25, 0.25, 0.20, 0.10, 0.20],
    "WebApp": [5, 5, 2, 3, 5],
    "Device-only app": [3, 2, 5, 5, 2],
    "spreadsheet file": [2, 2, 4, 1, 4],
})
scores = {
    col: float((delivery_options["weight"] * delivery_options[col]).sum())
    for col in ["WebApp", "Device-only app", "spreadsheet file"]
}
display(delivery_options)
display(pd.Series(scores, name="Weighted evaluation (5Perfect score)").sort_values(ascending=False).round(2).to_frame())

fig, ax = plt.subplots()
ax.bar(scores.keys(), scores.values(), color=["#4472C4", "#70AD47", "#A5A5A5"])
ax.set_title("Comparison of Provision Methods for Conservation Request Management (Hypothetical Evaluation)")
ax.set_xlabel("Delivery Methods")
ax.set_ylabel("Weighted evaluation (5Perfect score)")
ax.set_ylim(0, 5)
ax.grid(axis="y", alpha=0.3)
plt.tight_layout()
plt.show()| Evaluation Axis | weight | WebApp | Device-only app | spreadsheet file | |
|---|---|---|---|---|---|
| 0 | Multi-device support | 0.25 | 5 | 3 | 2 |
| 1 | ease of updating | 0.25 | 5 | 2 | 2 |
| 2 | Offline Tolerance | 0.20 | 2 | 5 | 4 |
| 3 | Camera Integration | 0.10 | 3 | 5 | 1 |
| 4 | Lightness of initial implementation | 0.20 | 5 | 2 | 4 |
| Weighted evaluation (5Perfect score) | |
|---|---|
| WebApp | 4.20 |
| Device-only app | 3.15 |
| spreadsheet file | 2.70 |
Reading the results
In this scenario, web apps are the most prominent. This is because it can be used on multiple shared devices and is easy to distribute updates all at once. However, if immediate registration is required in places without signal, offline support for web apps or dedicated apps is also a comparative option. Avoid judgments like “It’s not a business system because it’s web” or “It’s a business system and needs dedicated software.”
9. No.003: Organizing the Roles of Frontend, Backend, and DB
Meaning in Practice
The frontend supports screens viewed by workers and input, the backend handles business rules such as priority determination and permission verification, and the database (DB) is responsible for consistent storage of equipment, requests, and history. By sharing responsibility, changing the screen makes it less likely to disrupt the meaning of the history.
Approach to Analysis and Modeling
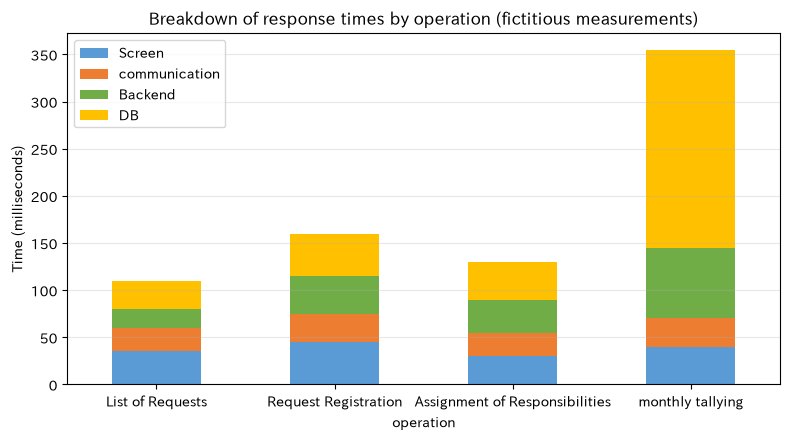
Response time: the sum of screen processing , communication , backend processing , and database processing
It will be broken down as such. Not only does it give the impression of being slow, but you can also determine which segment of the company should invest in improvements.
Check with Python
layer_roles = pd.DataFrame({
    "layer": ["Front End", "Backend", "DB"],
    "Responsibilities in the security app": ["Input, List, and Warning Display", "Certification, Priority, and State Transitions", "Storing Equipment, Requests, and Change History"],
    "Examples when it breaks": ["Difficult to input", "Allowing unauthorized state changes", "Missing or duplicate history"],
})
display(layer_roles)

routes = pd.DataFrame({
    "operation": ["List of Requests", "Request Registration", "Assignment of Responsibilities", "monthly tallying"],
    "Screen": [35, 45, 30, 40],
    "communication": [25, 30, 25, 30],
    "Backend": [20, 40, 35, 75],
    "DB": [30, 45, 40, 210],
}).set_index("operation")
display(routes.assign(total_milliseconds=routes.sum(axis=1)))

ax = routes.plot(kind="bar", stacked=True, color=["#5B9BD5", "#ED7D31", "#70AD47", "#FFC000"])
ax.set_title("Breakdown of response times by operation (fictitious measurements)")
ax.set_xlabel("operation")
ax.set_ylabel("Time (milliseconds)")
ax.grid(axis="y", alpha=0.3)
plt.xticks(rotation=0)
plt.tight_layout()
plt.show()| layer | Responsibilities in the security app | Examples when it breaks | |
|---|---|---|---|
| 0 | Front End | Input, List, and Warning Display | Difficult to input |
| 1 | Backend | Certification, Priority, and State Transitions | Allowing unauthorized state changes |
| 2 | DB | Storing Equipment, Requests, and Change History | Missing or duplicate history |
| Screen | communication | Backend | DB | total_milliseconds | |
|---|---|---|---|---|---|
| operation | |||||
| List of Requests | 35 | 25 | 20 | 30 | 110 |
| Request Registration | 45 | 30 | 40 | 45 | 160 |
| Assignment of Responsibilities | 30 | 25 | 35 | 40 | 130 |
| monthly tallying | 40 | 30 | 75 | 210 | 355 |
Reading the results
Monthly aggregation is dominated by database processing. Simply reducing the screen weight limits the range of improvements, so we should consider aggregation methods, indexes, and preliminary aggregation. On the other hand, time is distributed across each tier of request registration. Layered responsibility division not only covers the development team’s responsibilities but also serves as a unit for fault investigation and performance improvement.
10. No.004: Understanding Client-Server Configuration
Meaning in Practice
The browsers on on-site PCs or tablets serve as clients. The client requests a list of requests, the server checks permissions and conditions, retrieves data from the database, and returns the results. By aggregating data and critical business rules on the server side, inconsistencies between devices can be suppressed.
Approach to Analysis and Modeling
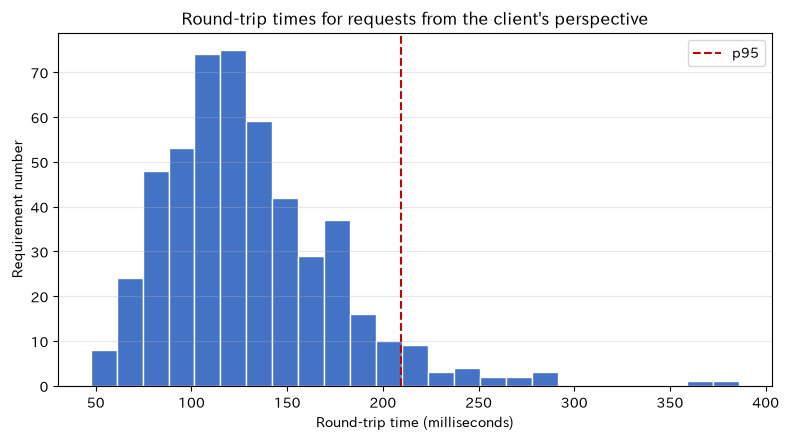
Between client and server, consider concurrent usage, network latency, processing time, and failure rate. This time, we simulate the round-trip time of the request and check the 95th percentile (p95). Average alone overlooks the slowness felt by some workers during busy times.
Check with Python
request_log = pd.DataFrame({
    "network_ms": rng.lognormal(mean=np.log(35), sigma=0.35, size=500),
    "server_ms": rng.lognormal(mean=np.log(90), sigma=0.45, size=500),
})
request_log["round_trip_ms"] = request_log.sum(axis=1)
latency_summary = request_log["round_trip_ms"].agg(["mean", "median", lambda s: s.quantile(.95), "max"])
latency_summary.index = ["average", "median", "p95", "largest"]
display(latency_summary.round(1).to_frame("Round-trip time (milliseconds)"))

fig, ax = plt.subplots()
ax.hist(request_log["round_trip_ms"], bins=25, color="#4472C4", edgecolor="white")
ax.axvline(request_log["round_trip_ms"].quantile(.95), color="#C00000", linestyle="--", label="p95")
ax.set_title("Round-trip times for requests from the client's perspective")
ax.set_xlabel("Round-trip time (milliseconds)")
ax.set_ylabel("Requirement number")
ax.grid(axis="y", alpha=0.3)
ax.legend()
plt.tight_layout()
plt.show()| Round-trip time (milliseconds) | |
|---|---|
| average | 129.7 |
| median | 123.2 |
| p95 | 209.7 |
| largest | 386.1 |
Reading the results
The distribution has a right hem, and the p95 is larger than average. Performance targets for business screens can be verified not only by setting targets like “average less than 1 second,” but also by setting them as “within a certain number of seconds under normal load.” Additionally, by measuring Wi-Fi latency and server processing separately within the factory, you can determine whether to prioritize network enhancement or app improvement.
11. No.005: Understanding HTTP Requests and Responses
Meaning in Practice
In web apps, the client sends an HTTP request, and the server returns an HTTP response. Requests should include methods, URLs, headers, and, if necessary, the body. Responses include state codes, headers, and body messages. By correctly handling status codes, users can distinguish between “input errors,” “insufficient permissions,” and “server failures.”
Approach to Analysis and Modeling
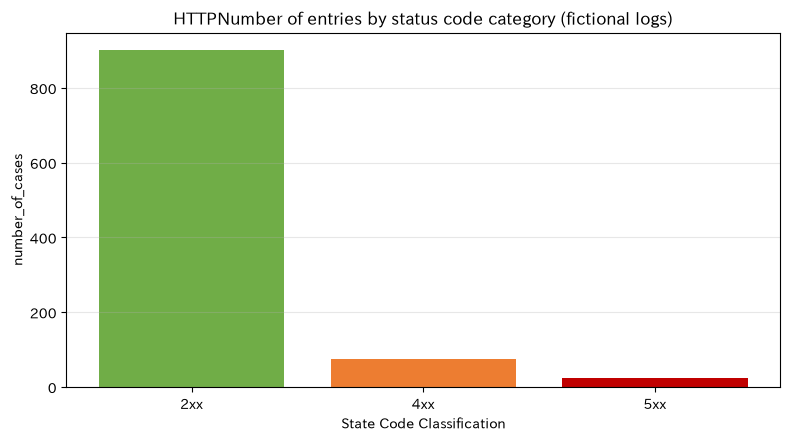
Monitors the proportion of normal and abnormal cases by operation. The success rate is
That’s right. However, the 400 series has input and permission issues, while the 500 series has internal server issues, so the person responsible for improvement is different.
Check with Python
http_samples = pd.DataFrame([
    ["GET", "/api/requests?status=open", 200, "List Success"],
    ["POST", "/api/requests", 201, "Request registration successful"],
    ["POST", "/api/requests", 400, "Insufficient mandatory items"],
    ["PATCH", "/api/requests/MR-0001", 403, "No update permission"],
    ["GET", "/api/requests/MR-9999", 404, "No target"],
    ["GET", "/api/summary", 500, "Failures in aggregation processing"],
], columns=["method", "path", "status", "Operational Significance"])
display(http_samples)

status_log = rng.choice([200, 201, 400, 403, 404, 500], 1000, p=[.70, .20, .035, .015, .035, .015])
status_class = pd.Series(status_log).map(lambda x: f"{x // 100}xx").value_counts().sort_index()
display(status_class.rename("number_of_cases").to_frame().assign(ratio=lambda x: (x["number_of_cases"] / x["number_of_cases"].sum()).round(3)))

fig, ax = plt.subplots()
ax.bar(status_class.index, status_class.values, color=["#70AD47", "#ED7D31", "#C00000"])
ax.set_title("HTTPNumber of entries by status code category (fictional logs)")
ax.set_xlabel("State Code Classification")
ax.set_ylabel("number_of_cases")
ax.grid(axis="y", alpha=0.3)
plt.tight_layout()
plt.show()| method | path | status | Operational Significance | |
|---|---|---|---|---|
| 0 | GET | /api/requests?status=open | 200 | List Success |
| 1 | POST | /api/requests | 201 | Request registration successful |
| 2 | POST | /api/requests | 400 | Insufficient mandatory items |
| 3 | PATCH | /api/requests/MR-0001 | 403 | No update permission |
| 4 | GET | /api/requests/MR-9999 | 404 | No target |
| 5 | GET | /api/summary | 500 | Failures in aggregation processing |
| number_of_cases | ratio | |
|---|---|---|
| 2xx | 902 | 0.902 |
| 4xx | 74 | 0.074 |
| 5xx | 24 | 0.024 |
Reading the results
Even if 2xx is the majority, treating 4xx and 5xx together as “errors” will be a mistake in countermeasures. For the 400, check the input guide; for the 403, check permission design; for the 404, check screen transitions and data synchronization; and for the 500, check the server logs and exception handling. Messages are converted not into status codes but into messages indicating the next action to be taken.
12. No.006: Understanding What an API Is
Meaning in Practice
An API is a contract for frontend and other systems to utilize backend functionality. For example, define a window for “obtaining an incomplete maintenance request” or “registering a new request.” Clarifying APIs makes it easier to reuse the same functions from sensors and production management systems in the future.
Approach to Analysis and Modeling
API contracts define input, output, state code, authentication, and business constraints. Here, we simulate local APIs with functions, filtering by query conditions, and checking JSON responses. Actual communication is not conducted, but the focus is on data contracts.
Check with Python
def get_maintenance_requests(data: pd.DataFrame, line: str | None = None, priority: str | None = None) -> dict:
    # A pure local function that mimics GET /api/maintenance-requests
    filtered = data.copy()
    if line is not None:
        filtered = filtered.loc[filtered["line"] == line]
    if priority is not None:
        filtered = filtered.loc[filtered["priority"] == priority]
    records = filtered[["request_id", "equipment_id", "line", "priority", "status"]].head(5).to_dict("records")
    return {"status": 200, "count": len(filtered), "items": records}

query = {"line": "A", "priority": "high"}
print("request : GET /api/maintenance-requests?" + urlencode(query))
api_response = get_maintenance_requests(requests, **query)
print("response:")
print(json.dumps(api_response, ensure_ascii=False, indent=2))

api_catalog = pd.DataFrame([
    ["GET", "/maintenance-requests", "List & Search", "worker/preserve/administrator"],
    ["POST", "/maintenance-requests", "New Registration", "worker/preserve"],
    ["PATCH", "/maintenance-requests/{id}", "Responsible and Status Update", "preserve"],
    ["GET", "/equipment/{id}", "See facility information", "all"],
    ["GET", "/reports/downtime", "Stop time aggregation", "administrator"],
], columns=["Method", "Pass", "Purpose", "user"])
display(api_catalog)
request : GET /api/maintenance-requests?line=A&priority=%E9%AB%98
response:
{
"status": 200,
"count": 10,
"items": [
{
"request_id": "MR-0009",
"equipment_id": "EQ-002",
"line": "A",
"priority": "High",
"status": "It's over"
},
{
"request_id": "MR-0052",
"equipment_id": "EQ-001",
"line": "A",
"priority": "High",
"status": "It's over"
},
{
"request_id": "MR-0055",
"equipment_id": "EQ-001",
"line": "A",
"priority": "High",
"status": "It's over"
},
{
"request_id": "MR-0068",
"equipment_id": "EQ-001",
"line": "A",
"priority": "High",
"status": "It's over"
},
{
"request_id": "MR-0069",
"equipment_id": "EQ-001",
"line": "A",
"priority": "High",
"status": "It's over"
}
]
}| Method | Pass | Purpose | user | |
|---|---|---|---|---|
| 0 | GET | /maintenance-requests | List & Search | worker/preserve/administrator |
| 1 | POST | /maintenance-requests | New Registration | worker/preserve |
| 2 | PATCH | /maintenance-requests/{id} | Responsible and Status Update | preserve |
| 3 | GET | /equipment/{id} | See facility information | all |
| 4 | GET | /reports/downtime | Stop time aggregation | administrator |
Reading the results
Even with the same list API, if you specify the line and priority as conditions, the screen side does not need to independently retrieve and filter all items. On the other hand, if APIs are tightly coupled only for screen convenience, they become difficult to reuse. It is important to define naming, search criteria, and updatable states centered around the operational resource called “Equipment Shutdown Cases.”
13. No.007: Organizing Items to Check in Requirements Definition
Meaning in Practice
In requirements definition, we examine the target business, users, functions, data, performance, availability, security, migration, operations, and acceptance conditions. Just saying “I want a list screen” doesn’t make you know who judges what. For example, “Team leaders can check unaddressed high-priority cases within 30 seconds at the start of the shift,” and establish conditions that can be evaluated with the work scene.
Approach to Analysis and Modeling
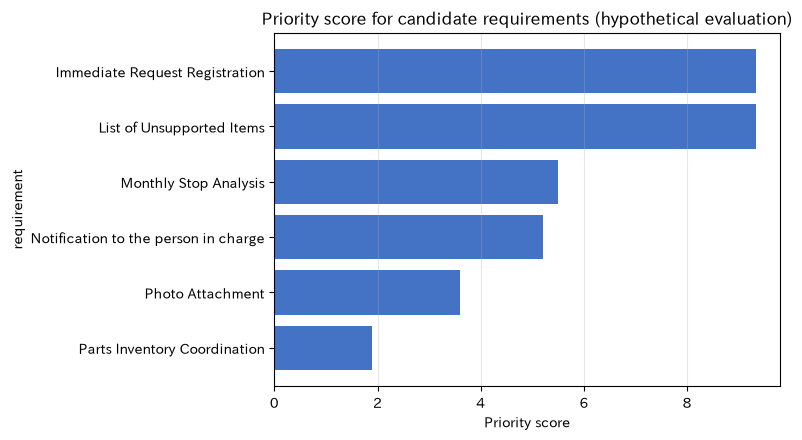
Candidate requirements are evaluated based on value, urgency, risk reduction, and scale of work. As a simple priority
We use it. Numbers are not a substitute for discussion, but tools to visualize the implicit weight of each department.
Check with Python
requirements = pd.DataFrame({
    "requirement": ["Immediate Request Registration", "List of Unsupported Items", "Notification to the person in charge", "Photo Attachment", "Monthly Stop Analysis", "Parts Inventory Coordination"],
    "Value": [10, 10, 9, 6, 8, 7],
    "Urgency": [10, 9, 9, 5, 6, 4],
    "Risk reduction": [8, 9, 8, 7, 8, 6],
    "scale of work": [3, 3, 5, 5, 4, 9],
})
requirements["Priority score"] = (
    requirements[["Value", "Urgency", "Risk reduction"]].sum(axis=1) / requirements["scale of work"]
)
requirements = requirements.sort_values("Priority score", ascending=False)
display(requirements.round(2))

fig, ax = plt.subplots()
ax.barh(requirements["requirement"][::-1], requirements["Priority score"][::-1], color="#4472C4")
ax.set_title("Priority score for candidate requirements (hypothetical evaluation)")
ax.set_xlabel("Priority score")
ax.set_ylabel("requirement")
ax.grid(axis="x", alpha=0.3)
plt.tight_layout()
plt.show()| requirement | Value | Urgency | Risk reduction | scale of work | Priority score | |
|---|---|---|---|---|---|---|
| 0 | Immediate Request Registration | 10 | 10 | 8 | 3 | 9.33 |
| 1 | List of Unsupported Items | 10 | 9 | 9 | 3 | 9.33 |
| 4 | Monthly Stop Analysis | 8 | 6 | 8 | 4 | 5.50 |
| 2 | Notification to the person in charge | 9 | 9 | 8 | 5 | 5.20 |
| 3 | Photo Attachment | 6 | 5 | 7 | 5 | 3.60 |
| 5 | Parts Inventory Coordination | 7 | 4 | 6 | 9 | 1.89 |
Reading the results
In the initial version, immediate registration and a list of unsupported items are priority candidates. While parts inventory coordination is valuable, its scale is large and it can be divided into subsequent stages. However, safety regulations are mandatory regardless of the score. Agree not only on functional requirements but also on users, performance, audit logs, backups, inquiry handling, and migration of existing data.
14. No.008: Understanding the Relationship Between Screen Design, API Design, and DB Design
Meaning in Practice
Input fields on the screen require the receiving API, and the information to be saved requires DB columns and related information. On the other hand, just having an item in the database does not determine who registers or refers to it when. If you proceed with the three designs separately, inconsistencies arise, such as being able to input on the screen but not being saved, and APIs being returned but not used on the screen.
Approach to Analysis and Modeling
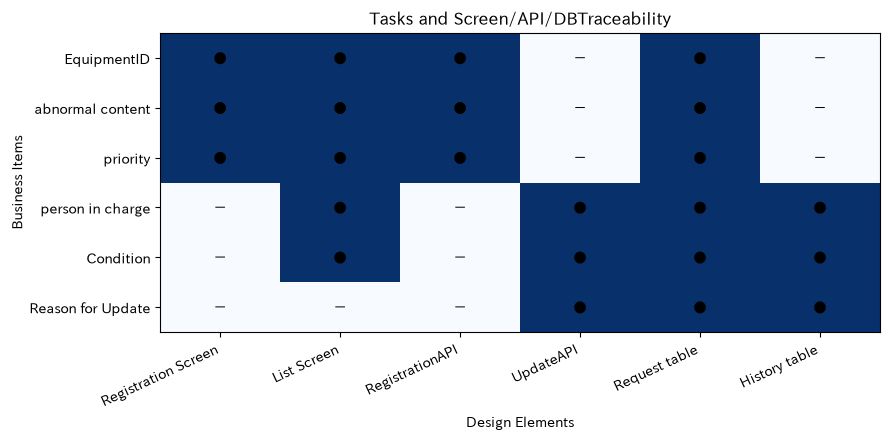
Check traceability from requirements to screens, APIs, and databases in a matrix. Place the business item in the row and the design element in the column, and set the corresponding correspondence to 1. Items with insufficient total lines are candidates for design omissions.
Check with Python
traceability = pd.DataFrame({
    "Registration Screen": [1, 1, 1, 0, 0, 0],
    "List Screen": [1, 1, 1, 1, 1, 0],
    "RegistrationAPI": [1, 1, 1, 0, 0, 0],
    "UpdateAPI": [0, 0, 0, 1, 1, 1],
    "Request table": [1, 1, 1, 1, 1, 1],
    "History table": [0, 0, 0, 1, 1, 1],
}, index=["EquipmentID", "abnormal content", "priority", "person in charge", "Condition", "Reason for Update"])
display(traceability)

fig, ax = plt.subplots(figsize=(9, 4.5))
im = ax.imshow(traceability.values, cmap="Blues", vmin=0, vmax=1, aspect="auto")
ax.set_xticks(range(len(traceability.columns)), traceability.columns, rotation=25, ha="right")
ax.set_yticks(range(len(traceability.index)), traceability.index)
for i in range(len(traceability.index)):
    for j in range(len(traceability.columns)):
        ax.text(j, i, "●" if traceability.iloc[i, j] else "-", ha="center", va="center")
ax.set_title("Tasks and Screen/API/DBTraceability")
ax.set_xlabel("Design Elements")
ax.set_ylabel("Business Items")
ax.grid(False)
plt.tight_layout()
plt.show()| Registration Screen | List Screen | RegistrationAPI | UpdateAPI | Request table | History table | |
|---|---|---|---|---|---|---|
| EquipmentID | 1 | 1 | 1 | 0 | 1 | 0 |
| abnormal content | 1 | 1 | 1 | 0 | 1 | 0 |
| priority | 1 | 1 | 1 | 0 | 1 | 0 |
| person in charge | 0 | 1 | 0 | 1 | 1 | 1 |
| Condition | 0 | 1 | 0 | 1 | 1 | 1 |
| Reason for Update | 0 | 0 | 0 | 1 | 1 | 1 |
Reading the results
The reason for updating is in the history table and the update API, but there is no input screen. As it is, recording is impossible unless you use the API directly, so adding a status update dialog or similar is necessary. While this matrix does not guarantee design integrity, it helps align “where to input, where to verify, where to save, and where to view” during review.
15. No.009: Identifying System Functions from Business Workflows
Meaning in Practice
If you consider the list of functions only in the meeting room, you can skip the on-site handover, waiting, and exceptions. First, break down the current operations (As-Is) into start conditions, responsibilities, tasks, decisions, handovers, records, and exceptions. On top of that, after systemization (To-Be), we separate the decisions left by the person and the processes to be automated.
Approach to Analysis and Modeling
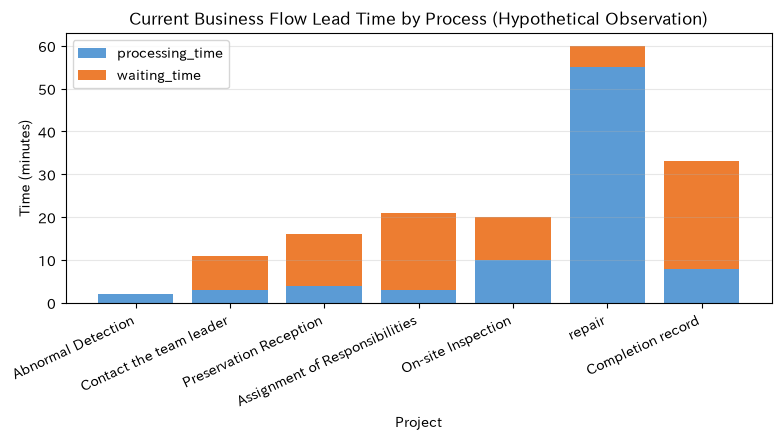
Separate processing time and waiting time for each process in the flow. The overall lead time is
That’s right. The system can reduce not only work time but also the waiting time for information to pass from person to person.
Check with Python
workflow = pd.DataFrame({
    "Project": ["Abnormal Detection", "Contact the team leader", "Preservation Reception", "Assignment of Responsibilities", "On-site Inspection", "repair", "Completion record"],
    "Person in charge": ["worker", "worker", "squad leader", "Person responsible for preservation", "Security officer", "Security officer", "Security officer"],
    "processing_time_minutes": [2, 3, 4, 3, 10, 55, 8],
    "waiting_time_minutes": [0, 8, 12, 18, 10, 5, 25],
    "Candidate Features": ["Request Registration", "automatic notification", "List of Receptions", "Assignment of Responsibilities", "See facility history", "Treatment Records", "Completion & History Saving"],
})
workflow["lead_time_minutes"] = workflow["processing_time_minutes"] + workflow["waiting_time_minutes"]
display(workflow)

fig, ax = plt.subplots()
ax.bar(workflow["Project"], workflow["processing_time_minutes"], label="processing_time", color="#5B9BD5")
ax.bar(workflow["Project"], workflow["waiting_time_minutes"], bottom=workflow["processing_time_minutes"], label="waiting_time", color="#ED7D31")
ax.set_title("Current Business Flow Lead Time by Process (Hypothetical Observation)")
ax.set_xlabel("Project")
ax.set_ylabel("Time (minutes)")
ax.grid(axis="y", alpha=0.3)
ax.legend()
plt.xticks(rotation=25, ha="right")
plt.tight_layout()
plt.show()| Project | Person in charge | processing_time_minutes | waiting_time_minutes | Candidate Features | lead_time_minutes | |
|---|---|---|---|---|---|---|
| 0 | Abnormal Detection | worker | 2 | 0 | Request Registration | 2 |
| 1 | Contact the team leader | worker | 3 | 8 | automatic notification | 11 |
| 2 | Preservation Reception | squad leader | 4 | 12 | List of Receptions | 16 |
| 3 | Assignment of Responsibilities | Person responsible for preservation | 3 | 18 | Assignment of Responsibilities | 21 |
| 4 | On-site Inspection | Security officer | 10 | 10 | See facility history | 20 |
| 5 | repair | Security officer | 55 | 5 | Treatment Records | 60 |
| 6 | Completion record | Security officer | 8 | 25 | Completion & History Saving | 33 |
Reading the results
The repair itself takes the longest, but there is also a long wait for assignments and completion records. Improving repair skills requires education and standard work, but reception lists, automatic notifications, assigning tasks, and completion reminders are examples of systems that can reduce waiting times. Do not force input during emergency stops to delay safe action. Include exception flow and post-registration as requirements.
16. No.010: Designing the overall structure of a small business app
Meaning in Practice
Integrate the first 9 exercises and design the minimum utility product (MVP). Users are workers, maintenance staff, and managers. Key features include request registration, list of unhandled items, updates on responsible and status, equipment history, and downtime aggregation. The basic configuration consists of a browser, web/API server, and database, and monitoring, backup, and authentication are not considered “unnecessary because they are small.”
Approach to Analysis and Modeling
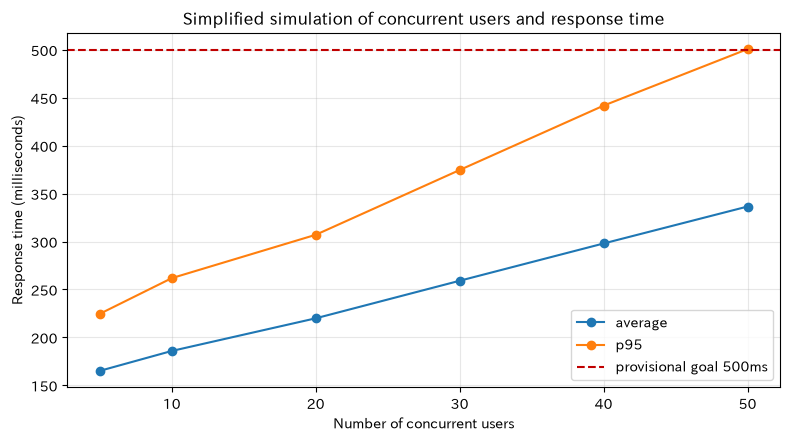
When selecting configurations, performance, availability, maintainability, security, and cost are aligned with your requirements. Here, we conduct a simple simulation of the P95 response time against the number of concurrent users to check whether the single configuration has enough capacity for test implementation. This is not a strict queue model, but rather hypothesis formation before the load test.
The expected structure is as follows.
[Factory PC/Tablet]
        │ HTTPS
        ▼
[Web/APIServer] ── [Monitoring and operation logs]
        │
        ▼
[BusinessDB] ── [Daily Backup]
Check with Python
architecture = pd.DataFrame([
    ["browser", "Registration, Listing, and Updates", "Reduce input load", "Usage confirmation on shared devices"],
    ["Web/APIServer", "Certification, Business Rules, and Aggregation", "Centralizing rules", "p95_response_time"],
    ["BusinessDB", "Facilities, Requests, and History Saving", "Integrity and Traceability", "Restoration Test"],
    ["Monitoring & Logs", "Recording of Failures and Operations", "Early Detection and Auditing", "Notification Training"],
    ["backup", "Recovery in Case of Failure", "Limiting data loss", "Regular restoration"],
], columns=["Components", "Responsibility", "Objectives of the business", "Main Verification"])
display(architecture)

users = np.array([5, 10, 20, 30, 40, 50])
simulation = []
for concurrent_users in users:
    samples = 110 + 2.2 * concurrent_users + rng.gamma(2.0, 18 + concurrent_users * 0.8, 1000)
    simulation.append([concurrent_users, samples.mean(), np.quantile(samples, .95)])
capacity = pd.DataFrame(simulation, columns=["Number of concurrent users", "average_response_time_ms", "p95_response_time_ms"])
display(capacity.round(1))

fig, ax = plt.subplots()
ax.plot(capacity["Number of concurrent users"], capacity["average_response_time_ms"], marker="o", label="average")
ax.plot(capacity["Number of concurrent users"], capacity["p95_response_time_ms"], marker="o", label="p95")
ax.axhline(500, color="#C00000", linestyle="--", label="provisional goal 500ms")
ax.set_title("Simplified simulation of concurrent users and response time")
ax.set_xlabel("Number of concurrent users")
ax.set_ylabel("Response time (milliseconds)")
ax.grid(True, alpha=0.3)
ax.legend()
plt.tight_layout()
plt.show()| Components | Responsibility | Objectives of the business | Main Verification | |
|---|---|---|---|---|
| 0 | browser | Registration, Listing, and Updates | Reduce input load | Usage confirmation on shared devices |
| 1 | Web/APIServer | Certification, Business Rules, and Aggregation | Centralizing rules | p95response time |
| 2 | BusinessDB | Facilities, Requests, and History Saving | Integrity and Traceability | Restoration Test |
| 3 | Monitoring & Logs | Recording of Failures and Operations | Early Detection and Auditing | Notification Training |
| 4 | backup | Recovery in Case of Failure | Limiting data loss | Regular restoration |
| Number of concurrent users | average_response_time_ms | p95response time_ms | |
|---|---|---|---|
| 0 | 5 | 165.1 | 224.6 |
| 1 | 10 | 185.8 | 261.8 |
| 2 | 20 | 219.9 | 307.0 |
| 3 | 30 | 259.1 | 374.6 |
| 4 | 40 | 298.0 | 441.8 |
| 5 | 50 | 336.5 | 500.8 |
Reading the results
Under this assumption, even with 50 people using simultaneously, the P95 will only reach less than 500 milliseconds. Therefore, a policy is to first implement a simple configuration for trial implementation, then decide on enhancement after actual measurement. However, simulations are not actual data. Before actual implementation, tests are conducted for peak operations, aggregation processing, communication outages, database failures, recovery from backups, and permission violations.
The boundaries of MVP are also important. Sensor automatic linkage, parts inventory, and predictive maintenance are future candidates, while the initial version focuses on reliably keeping the status and time of maintenance requests.
17. Practical Insights Seen Through Target Exercise
The most important thing throughout these ten is to establish the “decision we want to improve” before the technical configuration. In this case, the goal was for managers to identify equipment with long downtime, team leaders to ensure they did not overlook unhandled cases, and for maintenance staff to share history with their staff.
From the hypothetical data, the following insights can be drawn:
- Looking at not only the average but also the P95 allows you to grasp some of the slower experiences.
- Distinguishing between HTTP’s 4xx and 5xx allows you to separate on-site training from system modifications.
- Items that cannot be recorded or are not used can be discovered through the screen, API, and database compatibility tables.
- By dividing the business flow into processing and waiting, you can see where notifications and assignments can shorten the process.
- By narrowing down the MVP range, you can quickly obtain actual measurement data and move on to your next investment decisions.
KPIs for system implementation are tracked not only by login and registration counts but also by initial response time, downtime, unresolved congestion, record completion rate, and usage retention rate. Since changes in downtime are affected by production volume and busyness, evaluations are made by aligning lines, equipment, and priorities without simply comparing before and after implementation.
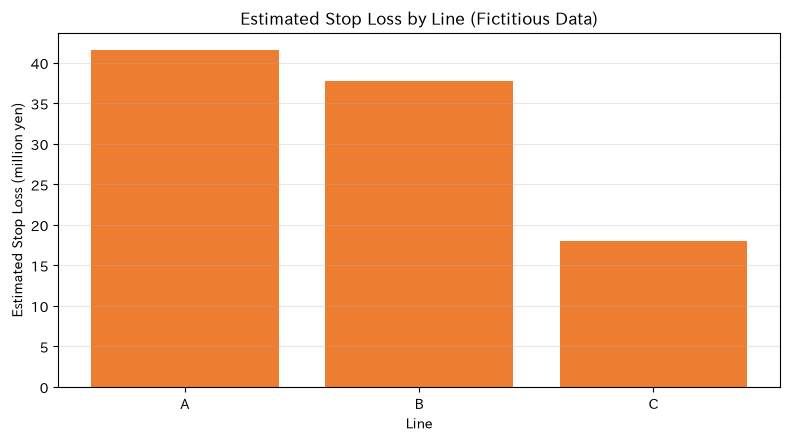
kpi = requests.groupby("line").agg(
    number_of_requests=("request_id", "count"),
    median_initial_response_time_minutes=("response_min", "median"),
    total_stopping_time_hours=("downtime_min", lambda s: s.sum() / 60),
    estimated_suspension_loss_million_yen=("estimated_loss_yen", lambda s: s.sum() / 1_000_000),
).round(1)
display(kpi)

fig, ax = plt.subplots()
ax.bar(kpi.index, kpi["estimated_suspension_loss_million_yen"], color="#ED7D31")
ax.set_title("Estimated Stop Loss by Line (Fictitious Data)")
ax.set_xlabel("Line")
ax.set_ylabel("Estimated Stop Loss (million yen)")
ax.grid(axis="y", alpha=0.3)
plt.tight_layout()
plt.show()| number_of_requests | Median initial response time_minutes | Total stopping time_hours | estimated_suspension_loss_million_yen | |
|---|---|---|---|---|
| line | ||||
| A | 39 | 27.8 | 62.3 | 41.6 |
| B | 49 | 26.3 | 78.2 | 37.8 |
| C | 32 | 26.1 | 58.5 | 18.0 |
18. What is necessary for practical implementation
In practical implementation, to move from notebook estimation to business systems, at least the following are implemented.
- On-site observation and consensus building: Observe the actual operations, emergencies, outsourced repairs, and handovers of each shift, and align terminology and completion conditions.
- Data definition: Define equipment ID, priority, cause, status, and time, and determine the person responsible for entering it. Existing equipment ledgers will also be maintained.
- acceptance criteria: For example, define “High-priority unresolved cases can be checked within 3 operations” and “All status changes can be tracked.”
- Non-functional requirements: Decide on concurrent usage, response time, uptime, authentication, permissions, audit, retention period, backup, and recovery goals.
- small-scale trial: Tested with a single line or limited user to measure input time, record completion rate, initial response time, and number of inquiries.
- Operations Design: Manage equipment masters, conduct account inventory, notify faults, approve changes, provide training, and establish contact points.
- Effectiveness Verification: Preserve the baseline values before implementation and continuously evaluate them considering equipment configuration and production load.
Even in systems that rarely handle personal information, worker names and operation histories are managed as subject to management. Minimum privileges, communication encryption, password management, audit logs, and vulnerability response are included in the initial design. Furthermore, when it becomes an official record of safety and quality, we verify the requirements for electronic records in accordance with internal regulations and relevant laws.
19. Summary
From No.001 to No.010, through a single operation called equipment maintenance requests, we connected the purpose of system development to the overall structure of a small-scale app.
- System development is an activity that integrates business, data, human decision-making, and operations
- Business systems represent the purpose, while web apps represent the delivery method.
- Frontend, backend, and database each have different responsibilities
- Clients and servers exchange requests and responses over HTTP, and the API becomes the contract.
- Reduce design omissions by making requirements, business flows, screens, APIs, and databases traceable.
- Implement small, measure KPIs and actual usage before scaling up.
In the next exercise group, we move on to development environments and Git where these designs can be implemented and operated.
20. Consultations for Corporations
At Surikoubo, we support system development in manufacturing, including business streamlining, requirements definition, data infrastructure, visualization, and AI and mathematical optimization. From stages such as “spreadsheet files continue to grow,” “wanting to connect on-site data to improvement decisions,” and “wanting to test small and verify investment returns,” we organize the issues and implementation scope together.
📩 Contact Us: surikobo.co.jp/contact
Please feel free to consult us first.