
100 Exercises / System Development / 100 Exercise on System Development
Introduction to Test Design for Manufacturing Systems | 10 Practical Tips for Learning Standalone, API, E2E, and Logs
Preventing Factory Operations System Shutdowns and Quality Leakage — 10 Key Tests and Quality Control Practices
Using manufacturing execution and quality management systems as the subject, we will continuously organize test types, backend, API, screen, E2E testing, type checking, linter, formmatter, log design, and exception investigation. The goal is not to increase the number of tests, but to create A system that quickly detects defects affecting quality, delivery times, and equipment operation, and reaches the root cause in a short time when they occur..
Instead of using external data, we use hypothetical test runs, static analysis, and failure logs generated in Python to check detection rates, execution times, change failure rates, and mean recovery time (MTTR) in tables and graphs.
[!NOTE] This material is a notebook previously used by Surikoubo (or personally by the representative, Kazuyama), and has been reconstructed, edited, and published with the company’s permission.
All data listed is fictional and has no relation whatsoever to real companies, factories, or figures.
Introduction: Practical Challenges in Manufacturing Covered in This Article
The factory’s operational system supports work instructions, performance collection, quality assessment, inventory reserves, and equipment coordination. Defects not only cause “screen distortion” but also spread to incorrect instructions, missed inspections, duplicate registrations, and loss of traceability. On the other hand, testing everything at the same depth delays release and slows down on-site improvements.
The challenges this time are the following three points.
- Deploying tests according to the impact of changes and operational risks
- Automating the confirmation of types, regulations, and formats, allowing people to focus on reviewing business specifications.
- Quickly investigate production exceptions from logs that can identify manufacturing instructions and equipment.
Common situations on site
- Biased toward manual checks of healthy systems, overlooking boundary values and permission differences
- The API alone succeeds, but a single operation from the screen causes double registration.
- Tests are slow and unstable, and won’t run when changed.
- Code reviews are spent pointing out gaps and naming, diluting discussions about business logic
- The failure log contains only one line of “error,” making it impossible to track the target factory, instructions, or processing.
These issues cannot be resolved by personal attention alone. It is necessary to incorporate detection into the development process and leave diagnostic information in case of failure.
Why is this issue so difficult to judge?
There are trade-offs in quality measures. E2E testing allows for broad visibility of user interactions, but tends to be slow and fragile. Detailed logs help with investigations but raise issues related to personal and confidential information and storage costs. Even if coverage is increased, it cannot be considered safe unless important business rules are verified.
| subject of judgment | Technical Specifications | Translation into manufacturing operations |
|---|---|---|
| Test Structure | Detection rate, execution time, instability rate | Quality leakage risk, release wait times |
| Static Analysis | Number of Incidents Pointed Out, Correction Time | Rework and Review Load |
| Log | Correlation ID assignment rate, deletion rate | Scope of impact time, MTTR |
| Exception handling | Detection time, recovery time | Production Downtime and Alternative Operating Hours |
Therefore, we track not only the “number of tests” but also the rate of critical failure exit, change failure rate, and recovery time.
Overview of Exercise covered this time
| No. | Theme | Practical Points to Check |
|---|---|---|
| 061 | Types of Tests | Risk-Based Test Allocation |
| 062 | Backend Unit Testing | Threshold values in quality judgment logic |
| 063 | API Testing | Contracts, Certifications, and Duplicate Registrations |
| 064 | Component testing | Screen Status and Operation Results |
| 065 | E2E Testing | Completion of critical business workflows |
| 066 | Type Check | Detection of data structure inconsistencies |
| 067 | Linter | Detection of descriptions that lead to defects |
| 068 | Formatter | Standardized formats and centralized reviews |
| 069 | Log design | Correlation IDs and structured logs |
| 070 | exception investigation | From detection to recovery and recurrence prevention |
Preparing the Python environment
Generate and aggregate fictional data using numpy and pandas, and visualize it in matplotlib. Japanese japanize_matplotlib is used for display. Since the random seed is fixed, running it again will yield the same result.
%matplotlib inline
%config InlineBackend.figure_format = 'svg'

import sys
import numpy as np
import pandas as pd
import matplotlib
import matplotlib.pyplot as plt
import japanize_matplotlib
from IPython.display import display

SEED = 20260712
rng = np.random.default_rng(SEED)
pd.options.display.max_columns = 20

print(f"Python     : {sys.version.split()[0]}")
print(f"numpy      : {np.__version__}")
print(f"pandas     : {pd.__version__}")
print(f"matplotlib : {matplotlib.__version__}")
print(f"random seed: {SEED}")
Python : 3.11.9
numpy : 1.26.4
pandas : 2.2.2
matplotlib : 3.9.2
random seed: 20260712Creation of Fictional Data
It generates 24-week releases, 1,200 potential defects, 900 API calls, 500 static parses, and 180 production exceptions. The target is a fictitious manufacturing execution and quality control system. The more severe the defect, the greater the impact on operations, and the detection probability and execution time are set to differ for each test layer.
The figures here are for educational simulation purposes and do not guarantee general effectiveness. In practice, probabilities and costs are updated using your company’s fault tags, CI history, and monitoring data.
n_defects = 1200
defects = pd.DataFrame({
    "defect_id": [f"D-{i:04d}" for i in range(1, n_defects + 1)],
    "severity": rng.choice(["significant", "high", "middle", "low"], n_defects, p=[0.08, 0.22, 0.45, 0.25]),
    "area": rng.choice(["Quality Assessment", "work instruction", "Record Registration", "Inventory Coordination", "Facility Integration"], n_defects),
})
test_layers = pd.DataFrame({
    "layer": ["single entity", "API", "Components", "E2E"],
    "detection_prob": [0.56, 0.48, 0.34, 0.27],
    "minutes_per_run": [4, 11, 16, 38],
    "flaky_rate_pct": [0.2, 0.5, 1.3, 3.8],
})

n_api = 900
api_calls = pd.DataFrame({
    "endpoint": rng.choice(["GET /orders", "POST /results", "POST /quality-decisions", "GET /inventory"], n_api),
    "status": rng.choice([200, 201, 400, 401, 409, 500], n_api, p=[.52, .25, .08, .04, .06, .05]),
    "latency_ms": np.clip(rng.lognormal(np.log(310), .65, n_api), 40, 5000).round(),
})

n_files = 500
static_files = pd.DataFrame({
    "module": rng.choice(["quality", "orders", "results", "inventory", "equipment"], n_files),
    "loc": rng.integers(60, 900, n_files),
    "type_errors": rng.poisson(0.42, n_files),
    "lint_errors": rng.poisson(0.66, n_files),
    "format_changes": rng.poisson(1.1, n_files),
})

n_incidents = 180
incidents = pd.DataFrame({
    "incident_id": [f"INC-{i:04d}" for i in range(1, n_incidents + 1)],
    "severity": rng.choice(["significant", "high", "middle"], n_incidents, p=[.16, .39, .45]),
    "correlation_id": rng.random(n_incidents) < .78,
    "order_id_logged": rng.random(n_incidents) < .70,
    "stacktrace_logged": rng.random(n_incidents) < .83,
})
base = rng.lognormal(np.log(95), .55, n_incidents)
completeness = incidents[["correlation_id", "order_id_logged", "stacktrace_logged"]].sum(axis=1)
incidents["mttr_min"] = np.clip(base * (1.55 - .20 * completeness), 12, 420).round()

print(f"Potential Issues: {len(defects):,}records / APICalling: {len(api_calls):,}records")
print(f"Analysis Targets: {len(static_files):,}File / Exception to the main event: {len(incidents):,}records")
display(test_layers)
Potential issues: 1,200 / API calls: 900
Analysis targets: 500 files / Execution exceptions: 180 cases| layer | detection_prob | minutes_per_run | flaky_rate_pct | |
|---|---|---|---|---|
| 0 | single entity | 0.56 | 4 | 0.2 |
| 1 | API | 0.48 | 11 | 0.5 |
| 2 | Components | 0.34 | 16 | 1.3 |
| 3 | E2E | 0.27 | 38 | 3.8 |
No.061: Organizing the Types of Tests
Meaning in Practice
Standalones, APIs, components, and E2E are not competing choices; they are layers that detect different defects at different speeds. Quality determination forms are tested in unit tests, input/output contracts are tested by API, warning displays are tested by component tests, and critical processes from inspection registration to approval are checked via E2E.
Approach to Analysis and Modeling
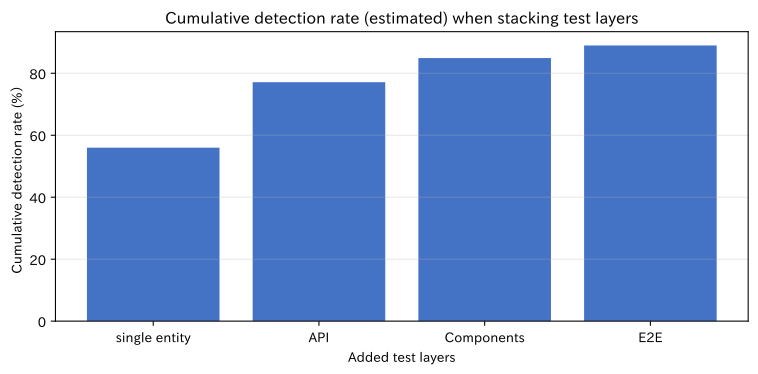
Assuming each layer is run independently, the cumulative detection rate is calculated from detection probability . Runtime and instability rates are also recorded, thickening the fast lower layers and narrowing down E2E to paths directly linked to stoppages and quality leakage. Evaluate the detection power of operational risks rather than coverage rates.
Check with Python
layers = test_layers.copy()
layers["expected_detected"] = (n_defects * layers["detection_prob"]).round().astype(int)
layers["detected_per_minute"] = (layers["expected_detected"] / layers["minutes_per_run"]).round(1)
layers["cumulative_detection_pct"] = (1 - (1 - layers["detection_prob"]).cumprod()) * 100
display(layers)

fig, ax = plt.subplots(figsize=(8, 4))
ax.bar(layers["layer"], layers["cumulative_detection_pct"], color="#4472C4")
ax.set_title("Cumulative detection rate (estimated) when stacking test layers")
ax.set_xlabel("Added test layers")
ax.set_ylabel("Cumulative detection rate (%)")
ax.grid(axis="y", alpha=.3)
plt.tight_layout()
plt.show()| layer | detection_prob | minutes_per_run | flaky_rate_pct | expected_detected | detected_per_minute | cumulative_detection_pct | |
|---|---|---|---|---|---|---|---|
| 0 | single entity | 0.56 | 4 | 0.2 | 672 | 168.0 | 56.000000 |
| 1 | API | 0.48 | 11 | 0.5 | 576 | 52.4 | 77.120000 |
| 2 | Components | 0.34 | 16 | 1.3 | 408 | 25.5 | 84.899200 |
| 3 | E2E | 0.27 | 38 | 3.8 | 324 | 8.5 | 88.976416 |
Reading the results
Lower-layer testing can detect many defects in a short time, and the more layers are stacked, the fewer missed items can be. However, since these are assumptions based on independence, we use the actual ratio as material to review the overlap and omission of the detected targets. The next practical step is to correspond to which group to prevent each major injury.
No.062: Writing Unit Tests for the Backend
Meaning in Practice
Pure business logic such as quality judgment, quantity consolidation, and inventory reserve can be quickly checked for numerous boundary values when separated from the database or network. In particular, handling exactly the lower and upper limits of the standard directly leads to quality leakage and excessive waste.
Approach to Analysis and Modeling
Compare measurement with lower limit and upper limit , and verify the function that accepts . Not only equivalence classes, but also the immediately before, matched, and immediately following boundaries are prepared. Missing input or unit differences are treated as separate tests.
def judge_quality(value, lsl, usl):
    if value is None: raise ValueError("Measurements are required")
    return "qualified" if lsl <= value <= usl else "unqualified"
Check with Python
def judge_quality(value, lsl=9.5, usl=10.5):
    if value is None:
        raise ValueError("Measurements are required")
    return "qualified" if lsl <= value <= usl else "unqualified"

cases = pd.DataFrame({
    "case": ["just before the lower limit", "Lower limit consistent", "center", "upper limit agreement", "Just after the cap"],
    "value": [9.49, 9.50, 10.00, 10.50, 10.51],
    "expected": ["unqualified", "qualified", "qualified", "qualified", "unqualified"],
})
cases["actual"] = cases["value"].map(judge_quality)
cases["passed"] = cases["expected"].eq(cases["actual"])
display(cases)
print(f"Success: {cases['passed'].sum()}/{len(cases)}records")| case | value | expected | actual | passed | |
|---|---|---|---|---|---|
| 0 | just before the lower limit | 9.49 | unqualified | unqualified | True |
| 1 | Lower limit consistent | 9.50 | qualified | qualified | True |
| 2 | center | 10.00 | qualified | qualified | True |
| 3 | upper limit agreement | 10.50 | qualified | qualified | True |
| 4 | Just after the cap | 10.51 | unqualified | unqualified | True |
Success: 5/5Reading the results
If the five boundary cases meet expectations, at least the inclusion relationships at the standard edge can be fixed. In practice, the specification values are not embedded in the code, but are linked to the part number, process, and application start date, and tests are conducted before and after the specification revision. It is important not only to have the number of passes, but also to add previously leaked defects to regression testing.
No.063: Writing API Tests
Meaning in Practice
API testing checks status codes, response types, authentication, input validation, and duplication prevention, all of which are promises made to the screen and external systems. The issue of resending after the performance registration API timeout and double counting causes simultaneous disruption of production numbers, inventory, and costs.
Approach to Analysis and Modeling
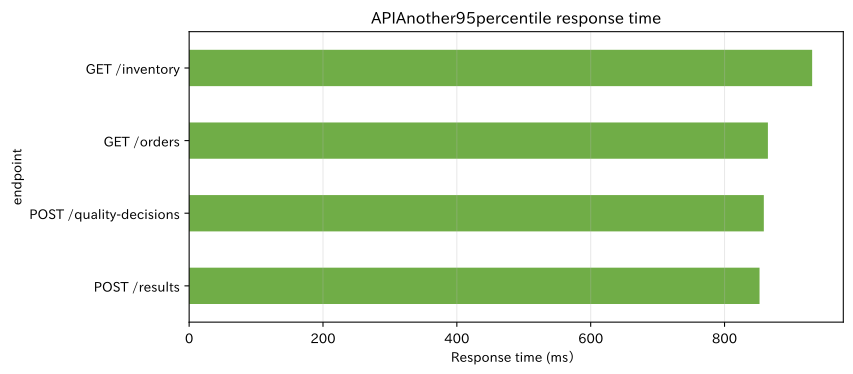
Aggregate the 95th percentile of success rate, client errors, server errors, and response times by endpoint. In the registration system, verify that resending the same idempotence key returns the same result. is the waiting time when 95% of all calls are filled.
def test_duplicate_request(client):
    headers = {"Idempotency-Key": "result-001"}
    first = client.post("/results", json=payload, headers=headers)
    second = client.post("/results", json=payload, headers=headers)
    assert first.json()["id"] == second.json()["id"]
Check with Python
api_kpi = api_calls.groupby("endpoint").agg(
    calls=("status", "size"),
    success_rate_pct=("status", lambda s: s.between(200, 299).mean() * 100),
    conflict_409=("status", lambda s: s.eq(409).sum()),
    server_error_5xx=("status", lambda s: s.ge(500).sum()),
    p95_latency_ms=("latency_ms", lambda s: s.quantile(.95)),
).round(1)
display(api_kpi)

fig, ax = plt.subplots(figsize=(9, 4))
api_kpi["p95_latency_ms"].sort_values().plot.barh(ax=ax, color="#70AD47")
ax.set_title("APIAnother95percentile response time")
ax.set_xlabel("Response time (ms)")
ax.set_ylabel("endpoint")
ax.grid(axis="x", alpha=.3)
plt.tight_layout()
plt.show()| calls | success_rate_pct | conflict_409 | server_error_5xx | p95_latency_ms | |
|---|---|---|---|---|---|
| endpoint | |||||
| GET /inventory | 228 | 75.0 | 11 | 11 | 930.9 |
| GET /orders | 209 | 78.0 | 13 | 13 | 864.8 |
| POST /quality-decisions | 208 | 75.5 | 6 | 15 | 858.7 |
| POST /results | 255 | 76.5 | 18 | 8 | 852.3 |
Reading the results
By separating success rates and trail delays by endpoint, you can discover user wait levels that may not be visible in averages. 409 does not determine whether it is based on the specification for duplication prevention or simply a competing fault by the response code alone; instead, it checks error codes and audit logs as well. In the test environment, the number of database updates is also verified.
No.064: Writing Frontend Component Tests
Meaning in Practice
On the manufacturing screen, it is important to see if a warning appears when an anomaly is received and whether the approval button is disabled. By verifying the user-visible wording, roles, and operation results rather than the details of the DOM structure, valuable tests remain even if internal implementations are changed.
Approach to Analysis and Modeling
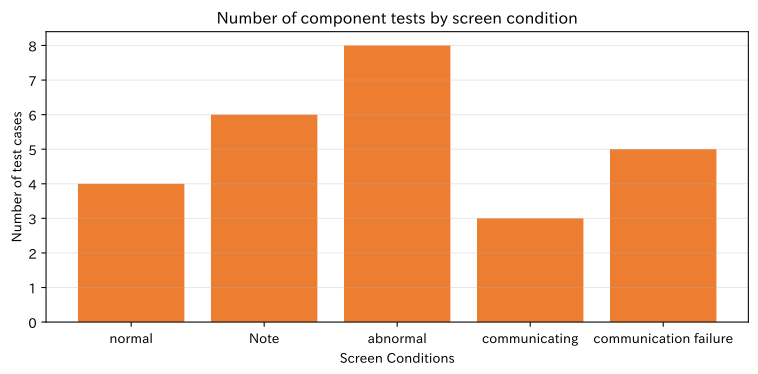
Screen states are divided into normal, caution, abnormal, in communication, and communication failure, and the expected display and operation status are displayed in a table. The State Transition Table is a concise model that visualizes combinatorial missing conditions. Instead of relying solely on snapshots, it also checks API calls and messages after clicking.
render(<QualityCard value={10.8} status="loaded" />);
expect(screen.getByRole("alert")).toHaveTextContent("Outside the standard");
expect(screen.getByRole("button", {name: "acknowledge"})).toBeDisabled();
Check with Python
ui_states = pd.DataFrame({
    "state": ["normal", "Note", "abnormal", "communicating", "communication failure"],
    "alert_visible": [False, True, True, False, True],
    "approve_enabled": [True, True, False, False, False],
    "retry_visible": [False, False, False, False, True],
    "test_cases": [4, 6, 8, 3, 5],
})
display(ui_states)

fig, ax = plt.subplots(figsize=(8, 4))
ax.bar(ui_states["state"], ui_states["test_cases"], color="#ED7D31")
ax.set_title("Number of component tests by screen condition")
ax.set_xlabel("Screen Conditions")
ax.set_ylabel("Number of test cases")
ax.grid(axis="y", alpha=.3)
plt.tight_layout()
plt.show()| state | alert_visible | approve_enabled | retry_visible | test_cases | |
|---|---|---|---|---|---|
| 0 | normal | False | True | False | 4 |
| 1 | Note | True | True | False | 6 |
| 2 | abnormal | True | False | False | 8 |
| 3 | communicating | False | False | False | 3 |
| 4 | communication failure | True | False | True | 5 |
Reading the results
Since abnormal conditions often involve a combination of display and operation restrictions, we check more thickly than for normal systems. The goal is not to increase the number of cases, but to prevent business-dangerous situations such as ‘approval is possible despite abnormalities’ or ‘cannot retry if it fails.’ Tests that are weak against wording changes use accessible roles or business-stable labels.
No.065: Understanding the Concept of E2E Testing
Meaning in Practice
E2E testing follows the same path as users from logging in, selecting work instructions, entering inspection values, quality approval, and reviewing history. While it can detect inconsistencies across system boundaries, the high execution time and maintenance costs require focus on critical flows related to shutdowns, quality, and regulatory issues.
Approach to Analysis and Modeling
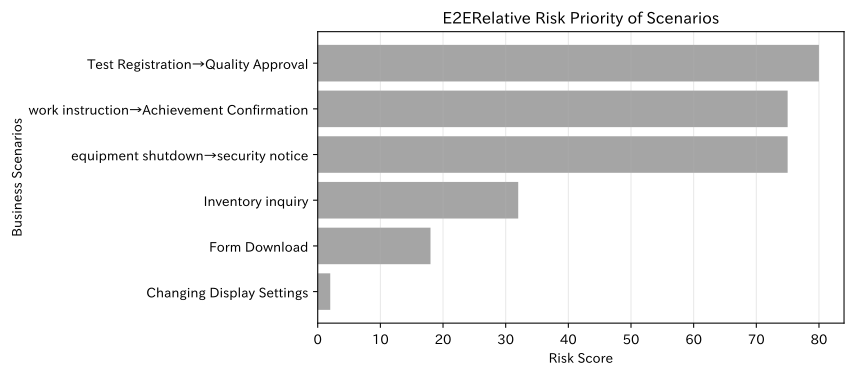
The business impact of each scenario is evaluated relative by the product of probability , impact , and difficulty of detection . This is not a strict loss amount, but rather a metric to agree on the priorities of E2E automation.
Check with Python
e2e = pd.DataFrame({
    "scenario": ["Test Registration→Quality Approval", "work instruction→Achievement Confirmation", "equipment shutdown→security notice", "Inventory inquiry", "Form Download", "Changing Display Settings"],
    "probability": [4, 5, 3, 4, 3, 2],
    "impact": [5, 5, 5, 4, 3, 1],
    "detectability": [4, 3, 5, 2, 2, 1],
    "runtime_min": [9, 8, 11, 5, 7, 3],
})
e2e["risk_score"] = e2e["probability"] * e2e["impact"] * e2e["detectability"]
e2e["priority_per_min"] = (e2e["risk_score"] / e2e["runtime_min"]).round(1)
e2e = e2e.sort_values("risk_score", ascending=False)
display(e2e)

fig, ax = plt.subplots(figsize=(9, 4))
ax.barh(e2e["scenario"], e2e["risk_score"], color="#A5A5A5")
ax.invert_yaxis()
ax.set_title("E2ERelative Risk Priority of Scenarios")
ax.set_xlabel("Risk Score")
ax.set_ylabel("Business Scenarios")
ax.grid(axis="x", alpha=.3)
plt.tight_layout()
plt.show()| scenario | probability | impact | detectability | runtime_min | risk_score | priority_per_min | |
|---|---|---|---|---|---|---|---|
| 0 | Test Registration→Quality Approval | 4 | 5 | 4 | 9 | 80 | 8.9 |
| 1 | work instruction→Achievement Confirmation | 5 | 5 | 3 | 8 | 75 | 9.4 |
| 2 | equipment shutdown→security notice | 3 | 5 | 5 | 11 | 75 | 6.8 |
| 3 | Inventory inquiry | 4 | 4 | 2 | 5 | 32 | 6.4 |
| 4 | Form Download | 3 | 3 | 2 | 7 | 18 | 2.6 |
| 5 | Changing Display Settings | 2 | 1 | 1 | 3 | 2 | 0.7 |
Reading the results
Sequences of operations, such as quality approval and performance confirmation, which have a significant impact in case of failure, are considered high. Instead of running everything every time, dividing Pull Request into short smoke tests and nighttime wide regression tests is also effective. Test data is independent, time-dependent, and alternative environments for external equipment are established to prevent unstable failures.
No.066: Introducing Type Check
Meaning in Practice
Inconsistencies such as passing part numbers to quantities, calculating missing measurements as numbers, or the screen not following API item name changes can be detected before execution with type checks. For Python, Mypy or pyright are options; for TypeScript, tsc are good options.
Approach to Analysis and Modeling
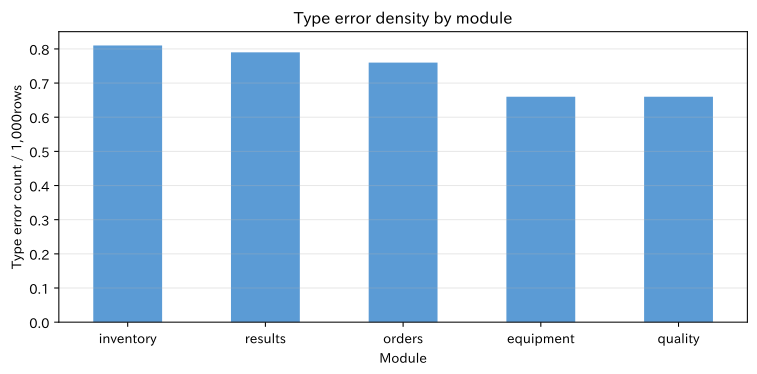
Calculate type error density (number per 1,000 lines) for each module. Since the number of entries alone puts larger modules at a disadvantage, normalization is done by line count. However, type error 0 does not guarantee the correctness of business logic and is combined with standalone and API testing.
def defect_rate(defects: int, produced: int) -> float:
    return defects / produced

# mypy --strict src/
Check with Python
type_kpi = static_files.groupby("module").agg(
    files=("module", "size"), loc=("loc", "sum"), type_errors=("type_errors", "sum")
)
type_kpi["errors_per_kloc"] = (type_kpi["type_errors"] / type_kpi["loc"] * 1000).round(2)
type_kpi = type_kpi.sort_values("errors_per_kloc", ascending=False)
display(type_kpi)

fig, ax = plt.subplots(figsize=(8, 4))
type_kpi["errors_per_kloc"].plot.bar(ax=ax, color="#5B9BD5")
ax.set_title("Type error density by module")
ax.set_xlabel("Module")
ax.set_ylabel("Type error count / 1,000rows")
ax.grid(axis="y", alpha=.3)
plt.xticks(rotation=0)
plt.tight_layout()
plt.show()| files | loc | type_errors | errors_per_kloc | |
|---|---|---|---|---|
| module | ||||
| inventory | 102 | 47159 | 38 | 0.81 |
| results | 112 | 53228 | 42 | 0.79 |
| orders | 90 | 43239 | 33 | 0.76 |
| equipment | 94 | 45690 | 30 | 0.66 |
| quality | 102 | 48213 | 32 | 0.66 |
Reading the results
Tightening the mold from dense modules makes it easier to introduce them gradually into existing systems. From the start, not making all errors mandatory fixes is a practical approach; new or changed code should have zero errors, and existing codes should not worsen the baseline values. Generating types from the API schema reduces the contracts between the backend and the screen.
No.067: Installing a Printer
Meaning in Practice
The linter automatically detects unused variables, unreachable code, dangerous exception handling, and overly complex functions. In manufacturing systems, issues such as except: pass hiding equipment communication errors can lead to monitoring omissions.
Approach to Analysis and Modeling
Check the density and types of points by module, and first make rules that lead to bugs mandatory. Activating all rules at once can be overwhelmed by a flood of formatting feedback, so stages are divided by severity, false positives, and correction costs. In Python, settings like Ruff are made the same in CI and editor.
ruff check src tests
ruff check src tests --output-format=github
Check with Python
lint_kpi = static_files.groupby("module").agg(
    loc=("loc", "sum"), lint_errors=("lint_errors", "sum")
)
lint_kpi["errors_per_kloc"] = (lint_kpi["lint_errors"] / lint_kpi["loc"] * 1000).round(2)
lint_kpi = lint_kpi.sort_values("errors_per_kloc", ascending=False)
display(lint_kpi)

rules = pd.DataFrame({
    "rule_group": ["Exceptional Crush", "Undefined / Unused", "complexity", "readability"],
    "findings": [38, 91, 54, 147],
    "gate": ["real-time error", "real-time error", "warning→Phased Implementation", "auto-fix"],
})
display(rules)| loc | lint_errors | errors_per_kloc | |
|---|---|---|---|
| module | |||
| orders | 43239 | 65 | 1.50 |
| inventory | 47159 | 65 | 1.38 |
| equipment | 45690 | 60 | 1.31 |
| results | 53228 | 69 | 1.30 |
| quality | 48213 | 56 | 1.16 |
| rule_group | findings | gate | |
|---|---|---|---|
| 0 | Exceptional Crush | 38 | real-time error |
| 1 | Undefined / Unused | 91 | real-time error |
| 2 | complexity | 54 | warning→Phased Implementation |
| 3 | readability | 147 | auto-fix |
Reading the results
Normalizing at the scale of modules allows for comparison of focus areas. At the time of introduction, exception grip and undefined references are CI failure conditions, and complexity starts with warnings, with handling adjusted according to the rule. Suppressed comments are left with reasons and regularly reviewed to prevent them from becoming permanent blind spots.
No.068: Introducing a Formatter
Meaning in Practice
Formatter unifies spaces, line breaks, quotation marks, and more, focusing reviews on specifications, safety, and maintainability. The goal is not to eliminate individual preferences, but to reduce meaningless differences and make important changes easier to see.
Approach to Analysis and Modeling
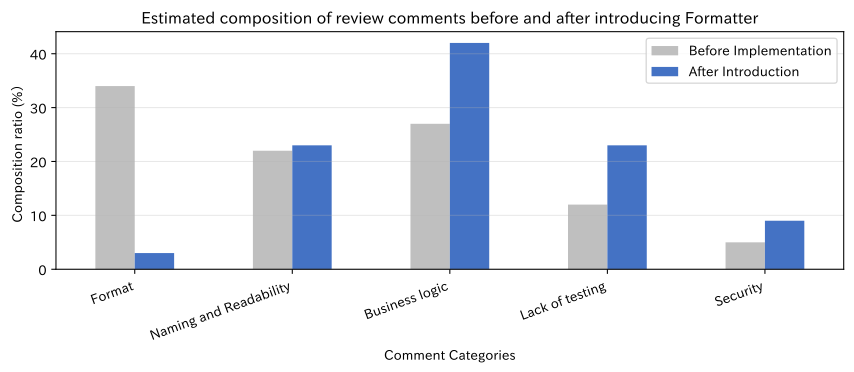
A simulation will be conducted comparing the breakdown of review comments before and after plastic surgery. By automating formatting comments, you can see how the proportion of available data for business logic within the same review time changes. For Python, Ruff format or Black is a good choice; for frontends, Prettier is a good choice.
ruff format src tests
ruff format --check src tests
Check with Python
review = pd.DataFrame({
    "category": ["Format", "Naming and Readability", "Business logic", "Lack of testing", "Security"],
    "Before Implementation": [34, 22, 27, 12, 5],
    "After Introduction": [3, 23, 42, 23, 9],
}).set_index("category")
display(review)

fig, ax = plt.subplots(figsize=(9, 4))
review.plot.bar(ax=ax, color=["#BFBFBF", "#4472C4"])
ax.set_title("Estimated composition of review comments before and after introducing Formatter")
ax.set_xlabel("Comment Categories")
ax.set_ylabel("Composition ratio (%)")
ax.grid(axis="y", alpha=.3)
plt.xticks(rotation=20, ha="right")
plt.tight_layout()
plt.show()| Before Implementation | After Introduction | |
|---|---|---|
| category | ||
| Format | 34 | 3 |
| Naming and Readability | 22 | 23 |
| Business logic | 27 | 42 |
| Lack of testing | 12 | 23 |
| Security | 5 | 9 |
Reading the results
Suppose there are fewer formatted comments, and reviews are directed toward insufficient business logic and testing. If all files are formatted at once, it becomes difficult to track the history, so commits for feature changes and modification are separated, and the migration timing is shared within the team. CI only checks whether the mold has been reshaped.
No.069: Designing Log Output
Meaning in Practice
Logs are evidence of failures, not just debug statements. By structuring and storing time, level, service, event name, correlation ID, factory/line, work instruction ID, and results, you can track the entire process from screen to API and batch. On the other hand, passwords, tokens, and unnecessary personal information are not recorded.
Approach to Analysis and Modeling
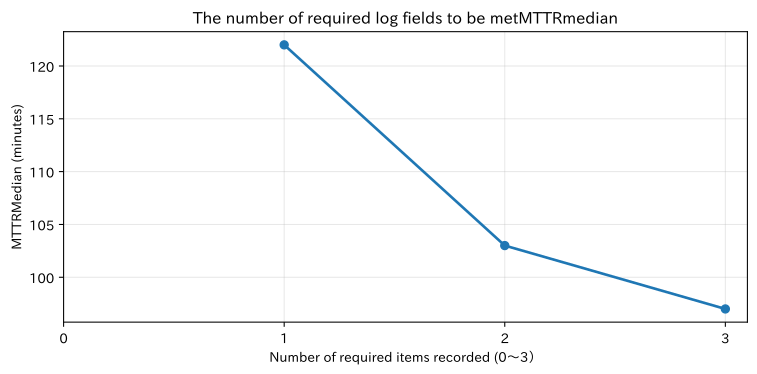
Log sufficiency is classified from 0 to 3 based on the number of records for the three required items, and its relationship with MTTR is compared. This is not proof of causality, but it indicates a candidate for improved diagnosticability. Correlation ID assignment rate and required item missing rate are set as operational KPIs.
logger.info("quality_decision_completed", extra={
    "correlation_id": cid, "order_id": order_id,
    "plant_id": plant_id, "result": "rejected"
})
Check with Python
incidents["log_completeness"] = incidents[["correlation_id", "order_id_logged", "stacktrace_logged"]].sum(axis=1)
log_kpi = incidents.groupby("log_completeness").agg(
    incidents=("incident_id", "size"), median_mttr_min=("mttr_min", "median"),
    p90_mttr_min=("mttr_min", lambda s: s.quantile(.9))
).round(1)
display(log_kpi)

fig, ax = plt.subplots(figsize=(8, 4))
ax.plot(log_kpi.index, log_kpi["median_mttr_min"], marker="o", linewidth=2)
ax.set_title("The number of required log fields to be metMTTRmedian")
ax.set_xlabel("Number of required items recorded (0〜3)")
ax.set_ylabel("MTTRMedian (minutes)")
ax.set_xticks([0, 1, 2, 3])
ax.grid(alpha=.3)
plt.tight_layout()
plt.show()| incidents | median_mttr_min | p90_mttr_min | |
|---|---|---|---|
| log_completeness | |||
| 1 | 19 | 122.0 | 269.0 |
| 2 | 77 | 103.0 | 253.0 |
| 3 | 84 | 97.0 | 173.1 |
Reading the results
In this hypothetical dataset, the more essential items are included, the shorter the median MTTR tends to be. However, due to confusion such as severity, it cannot be definitively stated that the effect is based solely on logs. In practice, correlation IDs are issued at the entry point and propagated to all services, and event names and item definitions are managed as log specifications. Retention period, viewing permissions, and masking are designed simultaneously.
No.070: Organizing Investigation Methods When Exceptions Occur
Meaning in Practice
In incident response, before immediately fixing code, the scope of impact is limited and safe alternative operations or rollbacks are determined. If there is a quality judgment error, shipments are suspended; if there is a failure in performance registration, the items are stored on paper or within the device, allowing technical recovery and business continuity to be carried out in parallel.
Approach to Analysis and Modeling
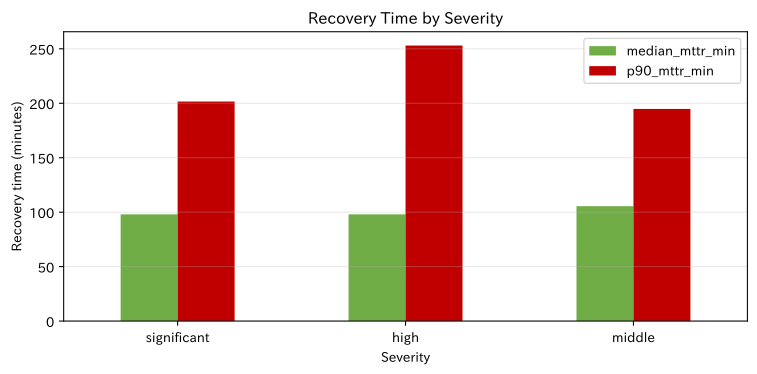
We break down responses into detection, primary segmentation, impact limitation, cause identification, recovery, and recurrence prevention. The average recovery time is , but critical failures check not only the median but also the 90th percentile. Using MTTR by log sufficiency level, estimate the effectiveness of improving survey procedures.
Check with Python
severity_order = ["significant", "high", "middle"]
incident_kpi = incidents.groupby("severity").agg(
    incidents=("incident_id", "size"),
    mean_mttr_min=("mttr_min", "mean"),
    median_mttr_min=("mttr_min", "median"),
    p90_mttr_min=("mttr_min", lambda s: s.quantile(.9)),
).reindex(severity_order).round(1)
display(incident_kpi)

runbook = pd.DataFrame({
    "phase": ["Detection", "primary segmentation", "Limited impact", "specific cause", "restoration", "Recurrence prevention"],
    "owner": ["Monitoring Officer", "Duty developer", "Factory manager", "Development and Infrastructure", "Change Responsible Person", "Development & Business Division"],
    "evidence": ["AlertKPI", "correlationID/Last-minute changes", "Target Factories / Instructions", "Log Trace Recreation", "Recovery confirmation and data consistency", "Causes, Countermeasures, and Deadlines"],
})
display(runbook)

fig, ax = plt.subplots(figsize=(8, 4))
incident_kpi[["median_mttr_min", "p90_mttr_min"]].plot.bar(ax=ax, color=["#70AD47", "#C00000"])
ax.set_title("Recovery Time by Severity")
ax.set_xlabel("Severity")
ax.set_ylabel("Recovery time (minutes)")
ax.grid(axis="y", alpha=.3)
plt.xticks(rotation=0)
plt.tight_layout()
plt.show()| incidents | mean_mttr_min | median_mttr_min | p90_mttr_min | |
|---|---|---|---|---|
| severity | ||||
| significant | 27 | 106.7 | 98.0 | 201.6 |
| high | 71 | 122.5 | 98.0 | 253.0 |
| middle | 82 | 113.4 | 105.5 | 194.8 |
| phase | owner | evidence | |
|---|---|---|---|
| 0 | Detection | Monitoring Officer | AlertKPI |
| 1 | primary segmentation | Duty developer | correlationID/Last-minute changes |
| 2 | Limited impact | Factory manager | Target Factories / Instructions |
| 3 | specific cause | Development and Infrastructure | Log Trace Recreation |
| 4 | restoration | Change Responsible Person | Recovery confirmation and data consistency |
| 5 | Recurrence prevention | Development & Business Division | Causes, Countermeasures, and Deadlines |
Reading the results
If p90 is greater than the median, it is important not to hide a small number of prolonged disorders only as the average. In the initial phase, we gather the pre-release data, scope, reproduction conditions, and correlation IDs, preserve evidence, and then perform safe recovery. Post-event reviews do not pursue individual responsibility, but rather break down areas of detection, defense, and diagnosis into measures and deadlines.
Practical Implications Seen Through Target Exercise
-
Testing is based on operational risks.
Defense layers are determined from routes with significant losses in case of failure, such as quality assessments, performance confirmations, and equipment shutdown notifications. -
Based on fast testing,E2EFocus on the most important flow
Short feedback is generated through standalone and API testing, and E2E focuses on representative scenarios that cross boundaries. -
Static analysis is a redistribution of review time
Automates types, regulations, and formats, allowing people to check business specifications, safety during exceptions, and insufficient testing. -
Log quality is part of recovery capability
Correlation IDs and business identifiers are structured and preserved, enabling tracking from monitoring to target instructions and processing history. -
Multiple qualityKPIManage by
We track not only the number and coverage of tests but also change failure rates, critical fault outflow rates, instability test rates, and MTTR.
What is necessary for practical implementation
1. Agree on Risks and Terms of Acceptance
In quality assurance, production management, on-site sites, and information systems, we organize tasks that must not be stopped, allowable downtime, and essential quality and legal requirements. Requirements are accepted not only for healthy systems, but also for boundaries, permissions, communication failures, and retransmissions.
2. Phased Introduction of CI Quality Gates
Automate single and API testing, type checks, linters, and format verification of change code. Record the baseline value for existing liabilities and start by preventing them from worsening with new differences. Instability tests are assigned responsibilities and correction deadlines.
3. Production equivalent test data and environment
Personal information and performance data are not directly duplicated; instead, anonymized or synthetic data is used. Integration with equipment and external core systems includes contract tests and simulators to reproduce time, time zones, retransmissions, and partial failures.
4. Observability and Incident Management
Organize structured logs, metrics, traces, and correlation IDs so you can move from alerts to manuals. Regularly train factories on business continuity procedures, communication networks, rollback permissions, and data recovery confirmation.
5. Continuous Improvement
Adding production failures to regression testing and improving log items and monitoring for prolonged investigations. KPIs are used to improve systems and processes rather than directly linking them to individual evaluations.
Conclusion
From No.061 to No.070, we identified the testing layers—backend, API, screen, E2E, mold, printer, former, log, and exception investigation—as part of the quality assurance process for the manufacturing execution and quality management system.
What matters is not simply introducing the tools. It means translating manufacturing risks into tests, automating what can be mechanically verified, and providing diagnosticable logs and recovery procedures for uncertainties left in production. The detection rate and MTTR confirmed from fictional data are the starting point, and we continuously update them with real-world CI history, failure reports, and monitoring data.
Consultations for Corporations
At Suri Kobo, we provide integrated support for manufacturing business systems, data analysis, and AI systems, covering everything from quality strategy, test automation, CI quality gates, logs and monitoring, to incident response procedures.
- We want to review the testing scope of quality and production systems based on risk.
- Want to automate API and screen regression testing
- Want to gradually introduce type check, printer, and CI into existing systems
- Fault investigations take time, and you want to improve logging, monitoring, and operations
For issues like these, you can consult with us on current status assessment, design, prototyping, implementation, and operational implementation.
📩 Contact Us: surikobo.co.jp/contact
Please feel free to consult us first.