
100 Exercises / Marketing Science / Marketing Science 100 Exercises
Introduction to Marketing Science in Manufacturing | Learning KPI, Causality, and Budget Optimization with Python
From ‘Intuition’ to ‘Decision-Making’ in Manufacturing B2B Marketing: 10 Steps into Marketing Science
Title & Overview
This notebook is an introductory guide for sales and marketing departments in manufacturing to make data-driven decisions about investments in exhibitions, technical seminars, web advertising, and more. Through all 100 courses, we progressed step by step to statistics, customer analysis, demand forecasting, pricing, recommendations, optimization, and management decision-making. In the first 10 articles, we examine the underlying Question,KPIModels, causality, uncertainty, simulation using data from a fictional industrial equipment manufacturer.
The goal of learning is not to memorize the methods. It means being able to explain decisions like, “Which measures to allocate to what, what to measure, and how to change next” in reproducible ways.
[!NOTE] This material is a notebook previously used by Surikoubo (or personally by the representative, Kazuyama), and has been reconstructed, edited, and published with the company’s permission.
All data listed is fictional and has no relation whatsoever to real companies, factories, or figures.
Introduction: Practical Challenges in Manufacturing Covered in This Article
The fictional industrial equipment manufacturer ‘Kobo Tech’ is receiving inquiries from multiple channels. However, it takes a long time to secure an order, and the scale of the project varies. Simply relying on lead counts or order numbers is not enough to decide whether to strengthen trade shows or web advertising.
In this article, marketing is treated not as an “aggregation of ads,” but as a Decision-making that allocates limited management resources to market opportunities. We look at not only sales but also gross profit, sales load, certainty, and variation simultaneously.
Common situations on site
- The definition of “results” varies by department
- The number of leads has increased, but the number of deals that sales can pursue has not increased.
- Last year’s results are being used directly for the next year’s budget
- When orders increase after a policy, people tend to interpret it as the effect of the initiative.
- Planning based solely on average values without determining how to respond to downside fluctuations
Why is this issue so difficult to judge?
In manufacturing B2B, there is a time lag between measures and order receipt, and business conditions, product strength, and sales activities all affect results. Observational data alone does not reveal false hypotheticals, that is, what would happen if no measures were taken. Also, correct predictions do not necessarily lead to correct actions. It is necessary to convert forecasted values into decision-making under the constraints of profit, capability, and risk.
Overview of Exercise covered this time
| No. | Theme | Questions to answer on site |
|---|---|---|
| 001 | What is Marketing Science? | How to connect data to decision-making |
| 002 | Why is mathematics necessary? | How to compare measures with different unit prices and probabilities |
| 003 | Data-Driven Management | How to change meetings using common metrics |
| 004 | KPI | How to connect leading indicators and outcome indicators |
| 005 | Decision-Making and Models | How to use order probabilities to assist decision-making |
| 006 | Correlation and Causality | How to avoid superficial effects |
| 007 | Optimization | Where to allocate the budget |
| 008 | uncertainty | How to handle not only averages but also downsides |
| 009 | Simulation | How to visualize the distribution of decision-making |
| 010 | Python environment setup | How to create reproducible analytical environments |
Preparing the Python environment
No external data is used. Generate random numbers with NumPy, aggregate them with pandas, and visualize them with matplotlib. Because the seed of the random number generator is fixed, the same result can be reproduced no matter how many times you run it.
import sys
import numpy as np
import pandas as pd
import matplotlib
import matplotlib.pyplot as plt
from IPython.display import display

rng = np.random.default_rng(42)
pd.set_option("display.max_columns", 20)
pd.set_option("display.float_format", lambda x: f"{x:,.2f}")
plt.rcParams["figure.figsize"] = (8, 4.5)
plt.rcParams["axes.unicode_minus"] = False

print("Python:", sys.version.split()[0])
print("NumPy:", np.__version__)
print("pandas:", pd.__version__)
print("matplotlib:", matplotlib.__version__)
Python: 3.11.9
NumPy: 1.26.4
pandas: 2.2.2
matplotlib: 3.9.2Creation of Fictional Data
We will build a track record of 24-month, four-channel initiatives. In addition to costs, lead numbers, negotiation rates, order probability, deal unit price, and gross profit margin, we also provide market indices. The amount is in ten thousand yen. In practice, CRM, advertising management, exhibition directories, and core system IDs are connected to create similar analysis tables.
months = pd.date_range("2024-01-01", periods=24, freq="MS")
channels = ["Exhibition", "Technical Seminar", "WebAdvertisement", "Introducing Existing Customers"]
base = {
    "Exhibition": (300, 85, 0.24, 0.22, 850, 0.35),
    "Technical Seminar": (130, 48, 0.31, 0.25, 720, 0.37),
    "WebAdvertisement": (180, 125, 0.14, 0.16, 520, 0.32),
    "Introducing Existing Customers": (70, 24, 0.44, 0.38, 980, 0.40),
}
rows = []
for t, month in enumerate(months):
    market = 100 + 8*np.sin(2*np.pi*t/12) + rng.normal(0, 3)
    for ch in channels:
        cost, leads0, opp_rate, win0, price0, margin = base[ch]
        spend = max(20, cost * rng.normal(1, 0.12))
        leads = rng.poisson(leads0 * (spend/cost)**0.65 * market/100)
        opportunities = rng.binomial(leads, opp_rate)
        win_prob = np.clip(win0 + 0.0025*(market-100), 0.05, 0.70)
        orders = rng.binomial(opportunities, win_prob)
        avg_price = max(200, price0 * rng.lognormal(0, 0.10))
        revenue = orders * avg_price
        gross_profit = revenue * margin - spend
        rows.append([month, ch, market, spend, leads, opportunities, orders,
                     avg_price, revenue, margin, gross_profit])

df = pd.DataFrame(rows, columns=["month", "channel", "market_index", "spend",
    "leads", "opportunities", "orders", "avg_price", "revenue", "margin_rate", "gross_profit"])
df["lead_to_opportunity"] = df["opportunities"] / df["leads"].replace(0, np.nan)
df["win_rate"] = df["orders"] / df["opportunities"].replace(0, np.nan)
display(df.head(8))
print(f"Number of lines: {len(df):,}, Number of Missing Items: {df.isna().sum().sum():,}")| month | channel | market_index | spend | leads | opportunities | orders | avg_price | revenue | margin_rate | gross_profit | lead_to_opportunity | win_rate | |
|---|---|---|---|---|---|---|---|---|---|---|---|---|---|
| 0 | 2024-01-01 | Exhibition | 100.91 | 262.56 | 90 | 16 | 7 | 860.94 | 6,026.55 | 0.35 | 1,846.73 | 0.18 | 0.44 |
| 1 | 2024-01-01 | Technical Seminar | 100.91 | 125.07 | 38 | 11 | 5 | 724.77 | 3,623.85 | 0.37 | 1,215.76 | 0.29 | 0.45 |
| 2 | 2024-01-01 | WebAdvertisement | 100.91 | 204.35 | 135 | 19 | 1 | 567.75 | 567.75 | 0.32 | -22.67 | 0.14 | 0.05 |
| 3 | 2024-01-01 | Introducing Existing Customers | 100.91 | 69.58 | 28 | 17 | 9 | 938.91 | 8,450.19 | 0.40 | 3,310.50 | 0.61 | 0.53 |
| 4 | 2024-02-01 | Exhibition | 102.94 | 319.16 | 68 | 18 | 5 | 816.15 | 4,080.74 | 0.35 | 1,109.09 | 0.26 | 0.28 |
| 5 | 2024-02-01 | Technical Seminar | 102.94 | 122.01 | 45 | 11 | 1 | 661.98 | 661.98 | 0.37 | 122.92 | 0.24 | 0.09 |
| 6 | 2024-02-01 | WebAdvertisement | 102.94 | 162.19 | 126 | 21 | 4 | 549.03 | 2,196.10 | 0.32 | 540.56 | 0.17 | 0.19 |
| 7 | 2024-02-01 | Introducing Existing Customers | 102.94 | 64.41 | 28 | 11 | 5 | 1,002.16 | 5,010.80 | 0.40 | 1,939.91 | 0.39 | 0.45 |
Number of lines: 96, Number of missing items: 0No.001: What is Marketing Science?
Meaning in Practice
Marketing science is the activity of quantifying customer understanding, forecasting, evaluating initiatives, and resource allocation to improve decision-making. The goal is not to create an analytical report itself, but to Clearly state options, evaluation criteria, and constraints when choosing actions.
Approach to Analysis and Modeling
Compare channel value by gross margin after investment expenses, not sales.
Check with Python
channel_summary = df.groupby("channel").agg(
    spend=("spend", "sum"), leads=("leads", "sum"), orders=("orders", "sum"),
    revenue=("revenue", "sum"), gross_profit=("gross_profit", "sum")
)
channel_summary["profit_per_spend"] = channel_summary["gross_profit"] / channel_summary["spend"]
display(channel_summary.sort_values("gross_profit", ascending=False).round(2))| spend | leads | orders | revenue | gross_profit | profit_per_spend | |
|---|---|---|---|---|---|---|
| channel | ||||||
| Introducing Existing Customers | 1,653.50 | 592 | 92 | 87,987.12 | 33,541.35 | 20.29 |
| Exhibition | 7,068.09 | 1996 | 123 | 103,732.18 | 29,238.17 | 4.14 |
| Technical Seminar | 3,131.49 | 1117 | 87 | 63,869.47 | 20,500.22 | 6.55 |
| WebAdvertisement | 4,317.58 | 3045 | 54 | 27,153.56 | 4,371.56 | 1.01 |
Reading the results
The rankings of sales, orders, and investment efficiency do not always match. The choice depends on whether management prioritizes “growth amount” or “capital efficiency.” The first step in analysis is not to come up with a single correct answer, but to agree on what to optimize.
No.002: Why Mathematics Is Necessary for Marketing
Meaning in Practice
If you choose strategies based solely on lead price, you may miss out on high-cost, high-probability deals. By converting probability and economic value to the same scale, you can compare different channels.
Approach to Analysis and Modeling
Expected gross profit margin for 1 lead
That’s how it is defined. The expected value is a long-term average and does not guarantee a single-month outcome.
Check with Python
economics = df.groupby("channel").agg(
    spend=("spend", "sum"), leads=("leads", "sum"), opportunities=("opportunities", "sum"),
    orders=("orders", "sum"), revenue=("revenue", "sum"), margin_rate=("margin_rate", "mean")
)
economics["opportunity_rate"] = economics["opportunities"] / economics["leads"]
economics["win_rate"] = economics["orders"] / economics["opportunities"]
economics["avg_order_value"] = economics["revenue"] / economics["orders"]
economics["cost_per_lead"] = economics["spend"] / economics["leads"]
economics["expected_value_per_lead"] = (economics["opportunity_rate"] * economics["win_rate"] *
    economics["avg_order_value"] * economics["margin_rate"] - economics["cost_per_lead"])
display(economics[["cost_per_lead", "opportunity_rate", "win_rate", "expected_value_per_lead"]].round(2))| cost_per_lead | opportunity_rate | win_rate | expected_value_per_lead | |
|---|---|---|---|---|
| channel | ||||
| WebAdvertisement | 1.42 | 0.13 | 0.13 | 1.44 |
| Exhibition | 3.54 | 0.25 | 0.24 | 14.65 |
| Technical Seminar | 2.80 | 0.33 | 0.24 | 18.35 |
| Introducing Existing Customers | 2.79 | 0.44 | 0.35 | 56.66 |
Reading the results
Cheap leads are not necessarily the most valuable leads. Mathematics translates chains of probability and amounts into a single evaluation axis. However, if you lack the ability to pursue customers, you should also include sales work in the expenses.
No.003: What is Data-Driven Management?
Meaning in Practice
Data-driven management is not about automatically following numbers. It means making defined data a common language and continuously updating hypotheses, judgments, results, and learning.
Approach to Analysis and Modeling
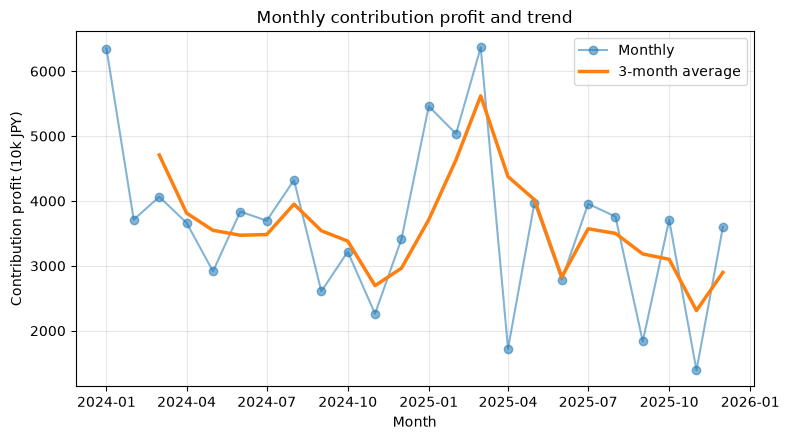
In the monthly management view, activity volume (costs), funnel (leads and negotiations), and results (orders and gross profit) are arranged at the same granularity. A structure that can show differences from previous years and targets is important.
Check with Python
monthly = df.groupby("month").agg(spend=("spend", "sum"), leads=("leads", "sum"),
    opportunities=("opportunities", "sum"), orders=("orders", "sum"),
    gross_profit=("gross_profit", "sum")).reset_index()
monthly["rolling_3m_profit"] = monthly["gross_profit"].rolling(3).mean()
display(monthly.tail(6).round(1))

fig, ax = plt.subplots()
ax.plot(monthly["month"], monthly["gross_profit"], marker="o", alpha=.55, label="Monthly")
ax.plot(monthly["month"], monthly["rolling_3m_profit"], linewidth=2.5, label="3-month average")
ax.set_title("Monthly contribution profit and trend")
ax.set_xlabel("Month"); ax.set_ylabel("Contribution profit (10k JPY)")
ax.grid(True, alpha=.3); ax.legend(); fig.tight_layout(); plt.show()| month | spend | leads | opportunities | orders | gross_profit | rolling_3m_profit | |
|---|---|---|---|---|---|---|---|
| 18 | 2025-07-01 | 653.50 | 279 | 56 | 16 | 3,956.50 | 3,571.70 |
| 19 | 2025-08-01 | 630.40 | 256 | 50 | 14 | 3,758.90 | 3,500.80 |
| 20 | 2025-09-01 | 684.80 | 244 | 60 | 8 | 1,835.10 | 3,183.50 |
| 21 | 2025-10-01 | 591.80 | 250 | 62 | 15 | 3,708.40 | 3,100.80 |
| 22 | 2025-11-01 | 652.70 | 250 | 55 | 9 | 1,389.40 | 2,310.90 |
| 23 | 2025-12-01 | 633.60 | 277 | 69 | 17 | 3,598.60 | 2,898.80 |
Reading the results
Monthly values fluctuate due to large contracts. Including the 3-month moving average makes it easier to read the trend. In meetings, it is important to record the “reasons for increases/decreases” and “next verification actions,” rather than just viewing the dashboard.
No.004: The Concept of KPIs
Meaning in Practice
Sales are important, but by the time the results are finalized, the move is delayed. KPIs are designed as indicators that the site can operate weekly and monthly, leading to future results.
Approach to Analysis and Modeling
The funnel can be represented by the following multiplicative factorization.
Gross profit is the final KGI, the number of deals and order rates are KPIs, and the amount of work such as email submissions is PI.
Check with Python
kpi = df.groupby("channel").agg(leads=("leads", "sum"), opportunities=("opportunities", "sum"),
    orders=("orders", "sum"), gross_profit=("gross_profit", "sum"))
kpi["opportunity_rate"] = kpi["opportunities"] / kpi["leads"]
kpi["win_rate"] = kpi["orders"] / kpi["opportunities"]
kpi["orders_reconstructed"] = kpi["leads"] * kpi["opportunity_rate"] * kpi["win_rate"]
display(kpi.round(3))

fig, ax = plt.subplots()
x = np.arange(len(kpi)); width = .35
ax.bar(x-width/2, kpi["opportunity_rate"], width, label="Lead to opportunity")
ax.bar(x+width/2, kpi["win_rate"], width, label="Win rate")
ax.set_title("Conversion KPIs by channel"); ax.set_xlabel("Channel"); ax.set_ylabel("Rate")
ax.set_xticks(x, kpi.index, rotation=15); ax.grid(True, axis="y", alpha=.3); ax.legend()
fig.tight_layout(); plt.show()| leads | opportunities | orders | gross_profit | opportunity_rate | win_rate | orders_reconstructed | |
|---|---|---|---|---|---|---|---|
| channel | |||||||
| WebAdvertisement | 3045 | 405 | 54 | 4,371.56 | 0.13 | 0.13 | 54.00 |
| Exhibition | 1996 | 508 | 123 | 29,238.17 | 0.26 | 0.24 | 123.00 |
| Technical Seminar | 1117 | 367 | 87 | 20,500.22 | 0.33 | 0.24 | 87.00 |
| Introducing Existing Customers | 592 | 262 | 92 | 33,541.35 | 0.44 | 0.35 | 92.00 |
/var/folders/3y/fmw40k0x78xblvb3gkcyvy1h0000gn/T/ipykernel_1522/1667793017.py:14: UserWarning: Glyph 24195 (\N{CJK UNIFIED IDEOGRAPH-5E83}) missing from font(s) DejaVu Sans.
  fig.tight_layout(); plt.show()
/var/folders/3y/fmw40k0x78xblvb3gkcyvy1h0000gn/T/ipykernel_1522/1667793017.py:14: UserWarning: Glyph 21578 (\N{CJK UNIFIED IDEOGRAPH-544A}) missing from font(s) DejaVu Sans.
  fig.tight_layout(); plt.show()
/var/folders/3y/fmw40k0x78xblvb3gkcyvy1h0000gn/T/ipykernel_1522/1667793017.py:14: UserWarning: Glyph 23637 (\N{CJK UNIFIED IDEOGRAPH-5C55}) missing from font(s) DejaVu Sans.
  fig.tight_layout(); plt.show()
/var/folders/3y/fmw40k0x78xblvb3gkcyvy1h0000gn/T/ipykernel_1522/1667793017.py:14: UserWarning: Glyph 31034 (\N{CJK UNIFIED IDEOGRAPH-793A}) missing from font(s) DejaVu Sans.
  fig.tight_layout(); plt.show()
/var/folders/3y/fmw40k0x78xblvb3gkcyvy1h0000gn/T/ipykernel_1522/1667793017.py:14: UserWarning: Glyph 20250 (\N{CJK UNIFIED IDEOGRAPH-4F1A}) missing from font(s) DejaVu Sans.
  fig.tight_layout(); plt.show()
/var/folders/3y/fmw40k0x78xblvb3gkcyvy1h0000gn/T/ipykernel_1522/1667793017.py:14: UserWarning: Glyph 25216 (\N{CJK UNIFIED IDEOGRAPH-6280}) missing from font(s) DejaVu Sans.
  fig.tight_layout(); plt.show()
/var/folders/3y/fmw40k0x78xblvb3gkcyvy1h0000gn/T/ipykernel_1522/1667793017.py:14: UserWarning: Glyph 34899 (\N{CJK UNIFIED IDEOGRAPH-8853}) missing from font(s) DejaVu Sans.
  fig.tight_layout(); plt.show()
/var/folders/3y/fmw40k0x78xblvb3gkcyvy1h0000gn/T/ipykernel_1522/1667793017.py:14: UserWarning: Glyph 12475 (\N{KATAKANA LETTER SE}) missing from font(s) DejaVu Sans.
  fig.tight_layout(); plt.show()
/var/folders/3y/fmw40k0x78xblvb3gkcyvy1h0000gn/T/ipykernel_1522/1667793017.py:14: UserWarning: Glyph 12511 (\N{KATAKANA LETTER MI}) missing from font(s) DejaVu Sans.
  fig.tight_layout(); plt.show()
/var/folders/3y/fmw40k0x78xblvb3gkcyvy1h0000gn/T/ipykernel_1522/1667793017.py:14: UserWarning: Glyph 12490 (\N{KATAKANA LETTER NA}) missing from font(s) DejaVu Sans.
  fig.tight_layout(); plt.show()
/var/folders/3y/fmw40k0x78xblvb3gkcyvy1h0000gn/T/ipykernel_1522/1667793017.py:14: UserWarning: Glyph 12540 (\N{KATAKANA-HIRAGANA PROLONGED SOUND MARK}) missing from font(s) DejaVu Sans.
  fig.tight_layout(); plt.show()
/var/folders/3y/fmw40k0x78xblvb3gkcyvy1h0000gn/T/ipykernel_1522/1667793017.py:14: UserWarning: Glyph 26082 (\N{CJK UNIFIED IDEOGRAPH-65E2}) missing from font(s) DejaVu Sans.
  fig.tight_layout(); plt.show()
/var/folders/3y/fmw40k0x78xblvb3gkcyvy1h0000gn/T/ipykernel_1522/1667793017.py:14: UserWarning: Glyph 23384 (\N{CJK UNIFIED IDEOGRAPH-5B58}) missing from font(s) DejaVu Sans.
  fig.tight_layout(); plt.show()
/var/folders/3y/fmw40k0x78xblvb3gkcyvy1h0000gn/T/ipykernel_1522/1667793017.py:14: UserWarning: Glyph 39015 (\N{CJK UNIFIED IDEOGRAPH-9867}) missing from font(s) DejaVu Sans.
  fig.tight_layout(); plt.show()
/var/folders/3y/fmw40k0x78xblvb3gkcyvy1h0000gn/T/ipykernel_1522/1667793017.py:14: UserWarning: Glyph 23458 (\N{CJK UNIFIED IDEOGRAPH-5BA2}) missing from font(s) DejaVu Sans.
  fig.tight_layout(); plt.show()
/var/folders/3y/fmw40k0x78xblvb3gkcyvy1h0000gn/T/ipykernel_1522/1667793017.py:14: UserWarning: Glyph 32057 (\N{CJK UNIFIED IDEOGRAPH-7D39}) missing from font(s) DejaVu Sans.
  fig.tight_layout(); plt.show()
/var/folders/3y/fmw40k0x78xblvb3gkcyvy1h0000gn/T/ipykernel_1522/1667793017.py:14: UserWarning: Glyph 20171 (\N{CJK UNIFIED IDEOGRAPH-4ECB}) missing from font(s) DejaVu Sans.
  fig.tight_layout(); plt.show()
/Users/hiroshi/anaconda3/lib/python3.11/site-packages/IPython/core/pylabtools.py:170: UserWarning: Glyph 24195 (\N{CJK UNIFIED IDEOGRAPH-5E83}) missing from font(s) DejaVu Sans.
  fig.canvas.print_figure(bytes_io, **kw)
/Users/hiroshi/anaconda3/lib/python3.11/site-packages/IPython/core/pylabtools.py:170: UserWarning: Glyph 21578 (\N{CJK UNIFIED IDEOGRAPH-544A}) missing from font(s) DejaVu Sans.
  fig.canvas.print_figure(bytes_io, **kw)
/Users/hiroshi/anaconda3/lib/python3.11/site-packages/IPython/core/pylabtools.py:170: UserWarning: Glyph 23637 (\N{CJK UNIFIED IDEOGRAPH-5C55}) missing from font(s) DejaVu Sans.
  fig.canvas.print_figure(bytes_io, **kw)
/Users/hiroshi/anaconda3/lib/python3.11/site-packages/IPython/core/pylabtools.py:170: UserWarning: Glyph 31034 (\N{CJK UNIFIED IDEOGRAPH-793A}) missing from font(s) DejaVu Sans.
  fig.canvas.print_figure(bytes_io, **kw)
/Users/hiroshi/anaconda3/lib/python3.11/site-packages/IPython/core/pylabtools.py:170: UserWarning: Glyph 20250 (\N{CJK UNIFIED IDEOGRAPH-4F1A}) missing from font(s) DejaVu Sans.
  fig.canvas.print_figure(bytes_io, **kw)
/Users/hiroshi/anaconda3/lib/python3.11/site-packages/IPython/core/pylabtools.py:170: UserWarning: Glyph 25216 (\N{CJK UNIFIED IDEOGRAPH-6280}) missing from font(s) DejaVu Sans.
  fig.canvas.print_figure(bytes_io, **kw)
/Users/hiroshi/anaconda3/lib/python3.11/site-packages/IPython/core/pylabtools.py:170: UserWarning: Glyph 34899 (\N{CJK UNIFIED IDEOGRAPH-8853}) missing from font(s) DejaVu Sans.
  fig.canvas.print_figure(bytes_io, **kw)
/Users/hiroshi/anaconda3/lib/python3.11/site-packages/IPython/core/pylabtools.py:170: UserWarning: Glyph 12475 (\N{KATAKANA LETTER SE}) missing from font(s) DejaVu Sans.
  fig.canvas.print_figure(bytes_io, **kw)
/Users/hiroshi/anaconda3/lib/python3.11/site-packages/IPython/core/pylabtools.py:170: UserWarning: Glyph 12511 (\N{KATAKANA LETTER MI}) missing from font(s) DejaVu Sans.
  fig.canvas.print_figure(bytes_io, **kw)
/Users/hiroshi/anaconda3/lib/python3.11/site-packages/IPython/core/pylabtools.py:170: UserWarning: Glyph 12490 (\N{KATAKANA LETTER NA}) missing from font(s) DejaVu Sans.
  fig.canvas.print_figure(bytes_io, **kw)
/Users/hiroshi/anaconda3/lib/python3.11/site-packages/IPython/core/pylabtools.py:170: UserWarning: Glyph 12540 (\N{KATAKANA-HIRAGANA PROLONGED SOUND MARK}) missing from font(s) DejaVu Sans.
  fig.canvas.print_figure(bytes_io, **kw)
/Users/hiroshi/anaconda3/lib/python3.11/site-packages/IPython/core/pylabtools.py:170: UserWarning: Glyph 26082 (\N{CJK UNIFIED IDEOGRAPH-65E2}) missing from font(s) DejaVu Sans.
  fig.canvas.print_figure(bytes_io, **kw)
/Users/hiroshi/anaconda3/lib/python3.11/site-packages/IPython/core/pylabtools.py:170: UserWarning: Glyph 23384 (\N{CJK UNIFIED IDEOGRAPH-5B58}) missing from font(s) DejaVu Sans.
  fig.canvas.print_figure(bytes_io, **kw)
/Users/hiroshi/anaconda3/lib/python3.11/site-packages/IPython/core/pylabtools.py:170: UserWarning: Glyph 39015 (\N{CJK UNIFIED IDEOGRAPH-9867}) missing from font(s) DejaVu Sans.
  fig.canvas.print_figure(bytes_io, **kw)
/Users/hiroshi/anaconda3/lib/python3.11/site-packages/IPython/core/pylabtools.py:170: UserWarning: Glyph 23458 (\N{CJK UNIFIED IDEOGRAPH-5BA2}) missing from font(s) DejaVu Sans.
  fig.canvas.print_figure(bytes_io, **kw)
/Users/hiroshi/anaconda3/lib/python3.11/site-packages/IPython/core/pylabtools.py:170: UserWarning: Glyph 32057 (\N{CJK UNIFIED IDEOGRAPH-7D39}) missing from font(s) DejaVu Sans.
  fig.canvas.print_figure(bytes_io, **kw)
/Users/hiroshi/anaconda3/lib/python3.11/site-packages/IPython/core/pylabtools.py:170: UserWarning: Glyph 20171 (\N{CJK UNIFIED IDEOGRAPH-4ECB}) missing from font(s) DejaVu Sans.
  fig.canvas.print_figure(bytes_io, **kw)
Reading the results
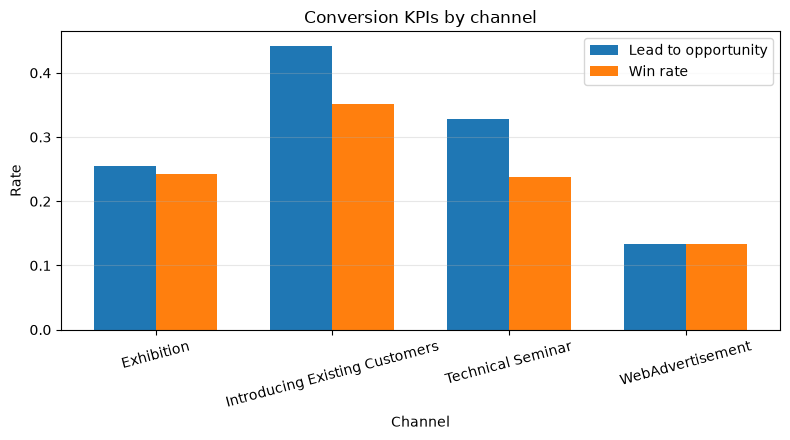
Even if the number of leads is high, a low negotiation rate will only increase the sales burden. KPIs are not indicators that blame departments, but rather instruments that identify bottlenecks. Manage definitions, responsible persons, update frequency, and execution methods as a set.
No.005: Decision-Making and Models
Meaning in Practice
The model is a condensation of reality. Rather than a complete reproduction, it leaves the elements necessary for a certain judgment. Here, we support you with whether to pursue clients based on order probabilities and expected gross profit.
Approach to Analysis and Modeling
For probability , gross profit margin on orders, and customer acquisition costs,
If it’s correct, then it’s a potential follower. However, elements that are difficult to quantify, such as strategic customers and learning value, are supplemented in the final decision.
Check with Python
deals = pd.DataFrame({
    "deal": [f"D-{i:03d}" for i in range(1, 9)],
    "win_probability": [0.12, .25, .32, .45, .55, .62, .70, .82],
    "gross_profit_if_won": [600, 420, 900, 300, 520, 750, 280, 450],
    "follow_up_cost": [50, 45, 85, 70, 65, 90, 55, 80]
})
deals["expected_net_value"] = deals["win_probability"]*deals["gross_profit_if_won"]-deals["follow_up_cost"]
deals["model_recommendation"] = np.where(deals["expected_net_value"] > 0, "Prioritize", "Review")
display(deals.sort_values("expected_net_value", ascending=False).round(1))| deal | win_probability | gross_profit_if_won | follow_up_cost | expected_net_value | model_recommendation | |
|---|---|---|---|---|---|---|
| 5 | D-006 | 0.60 | 750 | 90 | 375.00 | Prioritize |
| 7 | D-008 | 0.80 | 450 | 80 | 289.00 | Prioritize |
| 4 | D-005 | 0.60 | 520 | 65 | 221.00 | Prioritize |
| 2 | D-003 | 0.30 | 900 | 85 | 203.00 | Prioritize |
| 6 | D-007 | 0.70 | 280 | 55 | 141.00 | Prioritize |
| 3 | D-004 | 0.40 | 300 | 70 | 65.00 | Prioritize |
| 1 | D-002 | 0.20 | 420 | 45 | 60.00 | Prioritize |
| 0 | D-001 | 0.10 | 600 | 50 | 22.00 | Prioritize |
Reading the results
Even if the chances of getting orders are low, if the gross profit margin from the deal is high, it has value for attracting clients. Conversely, ranking based solely on accuracy overlooks economic value. Probability calibration, cost ranges, and exception approval rules must be regularly audited.
No.006: Correlation and Causality
Meaning in Practice
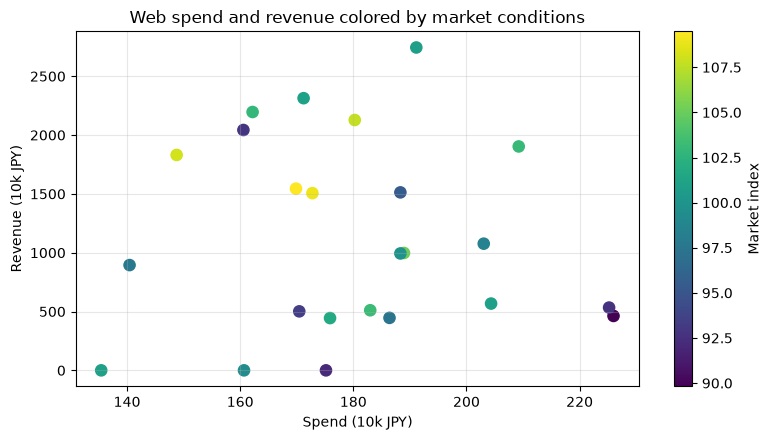
Even if advertising spend and sales increase simultaneously, it does not necessarily mean that advertising has increased sales. It may have been that advertising spending was increased during a boom period, and market conditions became a confounding factor.
Approach to Analysis and Modeling
Correlation refers to the strength with which variables move together, while causality refers to the relationship where outcomes vary depending on the intervention. Causality requires discriminative designs such as randomized comparisons, differences in differences, and regression discontinuities. Here, we also check the residual correlation after excluding market conditions, but this alone cannot prove causality.
Check with Python
web = df[df["channel"] == "WebAdvertisement"].copy()
raw_corr = web["spend"].corr(web["revenue"])
spend_coef = np.polyfit(web["market_index"], web["spend"], 1)
revenue_coef = np.polyfit(web["market_index"], web["revenue"], 1)
web["spend_residual"] = web["spend"] - np.polyval(spend_coef, web["market_index"])
web["revenue_residual"] = web["revenue"] - np.polyval(revenue_coef, web["market_index"])
adjusted_corr = web["spend_residual"].corr(web["revenue_residual"])
print(f"simple correlation: {raw_corr:.3f}")
print(f"Residual correlation excluding linear market effects: {adjusted_corr:.3f}")

fig, ax = plt.subplots()
sc = ax.scatter(web["spend"], web["revenue"], c=web["market_index"], cmap="viridis", s=65)
ax.set_title("Web spend and revenue colored by market conditions")
ax.set_xlabel("Spend (10k JPY)"); ax.set_ylabel("Revenue (10k JPY)")
ax.grid(True, alpha=.3); fig.colorbar(sc, ax=ax, label="Market index")
fig.tight_layout(); plt.show()
Simple correlation: -0.040
Residual correlation excluding linear market effects: 0.096
Reading the results
If the correlation changes before and after the correction, it becomes clear that interpreting the market without regard is dangerous. However, unobserved sales power and seasonality may also remain. In the next measure, we will consider experimental designs that randomly divide regions and customer groups.
No.007: The Concept of Optimization
Meaning in Practice
Even if the efficiency of each initiative is known, allocation is not self-evident due to budget limits, minimum spending requirements, and sales capability. Optimization explicitly explores candidates by clearly stating their objectives and constraints.
Approach to Analysis and Modeling
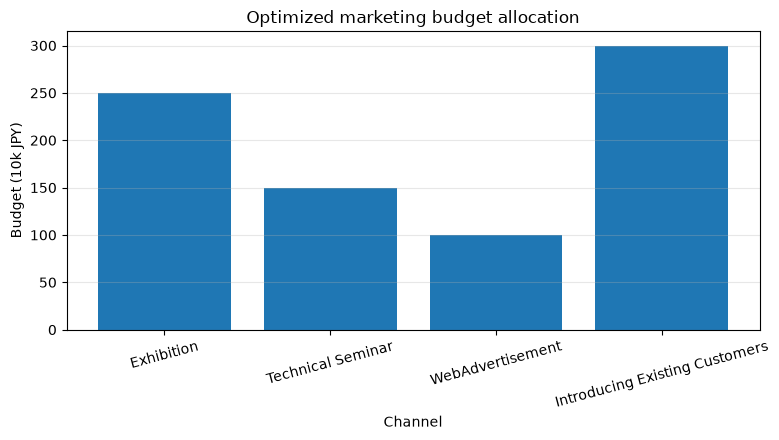
Maximize expected gross profit , including diminishing returns, against channel-specific budget .
As an introduction, I will list all combinations in 500,000 yen increments.
Check with Python
budget = 800
grid = np.arange(50, 501, 50)
response = {"Exhibition": (12.0, 240), "Technical Seminar": (10.5, 150),
            "WebAdvertisement": (8.5, 180), "Introducing Existing Customers": (14.0, 90)}
plans = []
for a in grid:
    for b in grid:
        for c in grid:
            for d in grid:
                alloc = np.array([a, b, c, d])
                if alloc.sum() <= budget:
                    expected = sum(scale*np.sqrt(x) - x*0.15 for x, (scale, _) in zip(alloc, response.values()))
                    plans.append([*alloc, expected])
plans = pd.DataFrame(plans, columns=[*channels, "expected_profit"])
best = plans.nlargest(5, "expected_profit")
display(best.round(1))

fig, ax = plt.subplots()
ax.bar(channels, best.iloc[0][channels])
ax.set_title("Optimized marketing budget allocation")
ax.set_xlabel("Channel"); ax.set_ylabel("Budget (10k JPY)")
ax.grid(True, axis="y", alpha=.3); ax.tick_params(axis="x", rotation=15)
fig.tight_layout(); plt.show()| Exhibition | Technical Seminar | WebAdvertisement | Introducing Existing Customers | expected_profit | |
|---|---|---|---|---|---|
| 1373 | 250 | 150 | 100 | 300 | 525.80 |
| 1208 | 200 | 200 | 100 | 300 | 525.70 |
| 1174 | 200 | 150 | 100 | 350 | 525.20 |
| 1180 | 200 | 150 | 150 | 300 | 524.90 |
| 1399 | 250 | 200 | 100 | 250 | 524.60 |
/var/folders/3y/fmw40k0x78xblvb3gkcyvy1h0000gn/T/ipykernel_1522/3625590457.py:23: UserWarning: Glyph 23637 (\N{CJK UNIFIED IDEOGRAPH-5C55}) missing from font(s) DejaVu Sans.
  fig.tight_layout(); plt.show()
/var/folders/3y/fmw40k0x78xblvb3gkcyvy1h0000gn/T/ipykernel_1522/3625590457.py:23: UserWarning: Glyph 31034 (\N{CJK UNIFIED IDEOGRAPH-793A}) missing from font(s) DejaVu Sans.
  fig.tight_layout(); plt.show()
/var/folders/3y/fmw40k0x78xblvb3gkcyvy1h0000gn/T/ipykernel_1522/3625590457.py:23: UserWarning: Glyph 20250 (\N{CJK UNIFIED IDEOGRAPH-4F1A}) missing from font(s) DejaVu Sans.
  fig.tight_layout(); plt.show()
/var/folders/3y/fmw40k0x78xblvb3gkcyvy1h0000gn/T/ipykernel_1522/3625590457.py:23: UserWarning: Glyph 25216 (\N{CJK UNIFIED IDEOGRAPH-6280}) missing from font(s) DejaVu Sans.
  fig.tight_layout(); plt.show()
/var/folders/3y/fmw40k0x78xblvb3gkcyvy1h0000gn/T/ipykernel_1522/3625590457.py:23: UserWarning: Glyph 34899 (\N{CJK UNIFIED IDEOGRAPH-8853}) missing from font(s) DejaVu Sans.
  fig.tight_layout(); plt.show()
/var/folders/3y/fmw40k0x78xblvb3gkcyvy1h0000gn/T/ipykernel_1522/3625590457.py:23: UserWarning: Glyph 12475 (\N{KATAKANA LETTER SE}) missing from font(s) DejaVu Sans.
  fig.tight_layout(); plt.show()
/var/folders/3y/fmw40k0x78xblvb3gkcyvy1h0000gn/T/ipykernel_1522/3625590457.py:23: UserWarning: Glyph 12511 (\N{KATAKANA LETTER MI}) missing from font(s) DejaVu Sans.
  fig.tight_layout(); plt.show()
/var/folders/3y/fmw40k0x78xblvb3gkcyvy1h0000gn/T/ipykernel_1522/3625590457.py:23: UserWarning: Glyph 12490 (\N{KATAKANA LETTER NA}) missing from font(s) DejaVu Sans.
  fig.tight_layout(); plt.show()
/var/folders/3y/fmw40k0x78xblvb3gkcyvy1h0000gn/T/ipykernel_1522/3625590457.py:23: UserWarning: Glyph 12540 (\N{KATAKANA-HIRAGANA PROLONGED SOUND MARK}) missing from font(s) DejaVu Sans.
  fig.tight_layout(); plt.show()
/var/folders/3y/fmw40k0x78xblvb3gkcyvy1h0000gn/T/ipykernel_1522/3625590457.py:23: UserWarning: Glyph 24195 (\N{CJK UNIFIED IDEOGRAPH-5E83}) missing from font(s) DejaVu Sans.
  fig.tight_layout(); plt.show()
/var/folders/3y/fmw40k0x78xblvb3gkcyvy1h0000gn/T/ipykernel_1522/3625590457.py:23: UserWarning: Glyph 21578 (\N{CJK UNIFIED IDEOGRAPH-544A}) missing from font(s) DejaVu Sans.
  fig.tight_layout(); plt.show()
/var/folders/3y/fmw40k0x78xblvb3gkcyvy1h0000gn/T/ipykernel_1522/3625590457.py:23: UserWarning: Glyph 26082 (\N{CJK UNIFIED IDEOGRAPH-65E2}) missing from font(s) DejaVu Sans.
  fig.tight_layout(); plt.show()
/var/folders/3y/fmw40k0x78xblvb3gkcyvy1h0000gn/T/ipykernel_1522/3625590457.py:23: UserWarning: Glyph 23384 (\N{CJK UNIFIED IDEOGRAPH-5B58}) missing from font(s) DejaVu Sans.
  fig.tight_layout(); plt.show()
/var/folders/3y/fmw40k0x78xblvb3gkcyvy1h0000gn/T/ipykernel_1522/3625590457.py:23: UserWarning: Glyph 39015 (\N{CJK UNIFIED IDEOGRAPH-9867}) missing from font(s) DejaVu Sans.
  fig.tight_layout(); plt.show()
/var/folders/3y/fmw40k0x78xblvb3gkcyvy1h0000gn/T/ipykernel_1522/3625590457.py:23: UserWarning: Glyph 23458 (\N{CJK UNIFIED IDEOGRAPH-5BA2}) missing from font(s) DejaVu Sans.
  fig.tight_layout(); plt.show()
/var/folders/3y/fmw40k0x78xblvb3gkcyvy1h0000gn/T/ipykernel_1522/3625590457.py:23: UserWarning: Glyph 32057 (\N{CJK UNIFIED IDEOGRAPH-7D39}) missing from font(s) DejaVu Sans.
  fig.tight_layout(); plt.show()
/var/folders/3y/fmw40k0x78xblvb3gkcyvy1h0000gn/T/ipykernel_1522/3625590457.py:23: UserWarning: Glyph 20171 (\N{CJK UNIFIED IDEOGRAPH-4ECB}) missing from font(s) DejaVu Sans.
  fig.tight_layout(); plt.show()
/Users/hiroshi/anaconda3/lib/python3.11/site-packages/IPython/core/pylabtools.py:170: UserWarning: Glyph 23637 (\N{CJK UNIFIED IDEOGRAPH-5C55}) missing from font(s) DejaVu Sans.
  fig.canvas.print_figure(bytes_io, **kw)
/Users/hiroshi/anaconda3/lib/python3.11/site-packages/IPython/core/pylabtools.py:170: UserWarning: Glyph 31034 (\N{CJK UNIFIED IDEOGRAPH-793A}) missing from font(s) DejaVu Sans.
  fig.canvas.print_figure(bytes_io, **kw)
/Users/hiroshi/anaconda3/lib/python3.11/site-packages/IPython/core/pylabtools.py:170: UserWarning: Glyph 20250 (\N{CJK UNIFIED IDEOGRAPH-4F1A}) missing from font(s) DejaVu Sans.
  fig.canvas.print_figure(bytes_io, **kw)
/Users/hiroshi/anaconda3/lib/python3.11/site-packages/IPython/core/pylabtools.py:170: UserWarning: Glyph 25216 (\N{CJK UNIFIED IDEOGRAPH-6280}) missing from font(s) DejaVu Sans.
  fig.canvas.print_figure(bytes_io, **kw)
/Users/hiroshi/anaconda3/lib/python3.11/site-packages/IPython/core/pylabtools.py:170: UserWarning: Glyph 34899 (\N{CJK UNIFIED IDEOGRAPH-8853}) missing from font(s) DejaVu Sans.
  fig.canvas.print_figure(bytes_io, **kw)
/Users/hiroshi/anaconda3/lib/python3.11/site-packages/IPython/core/pylabtools.py:170: UserWarning: Glyph 12475 (\N{KATAKANA LETTER SE}) missing from font(s) DejaVu Sans.
  fig.canvas.print_figure(bytes_io, **kw)
/Users/hiroshi/anaconda3/lib/python3.11/site-packages/IPython/core/pylabtools.py:170: UserWarning: Glyph 12511 (\N{KATAKANA LETTER MI}) missing from font(s) DejaVu Sans.
  fig.canvas.print_figure(bytes_io, **kw)
/Users/hiroshi/anaconda3/lib/python3.11/site-packages/IPython/core/pylabtools.py:170: UserWarning: Glyph 12490 (\N{KATAKANA LETTER NA}) missing from font(s) DejaVu Sans.
  fig.canvas.print_figure(bytes_io, **kw)
/Users/hiroshi/anaconda3/lib/python3.11/site-packages/IPython/core/pylabtools.py:170: UserWarning: Glyph 12540 (\N{KATAKANA-HIRAGANA PROLONGED SOUND MARK}) missing from font(s) DejaVu Sans.
  fig.canvas.print_figure(bytes_io, **kw)
/Users/hiroshi/anaconda3/lib/python3.11/site-packages/IPython/core/pylabtools.py:170: UserWarning: Glyph 24195 (\N{CJK UNIFIED IDEOGRAPH-5E83}) missing from font(s) DejaVu Sans.
  fig.canvas.print_figure(bytes_io, **kw)
/Users/hiroshi/anaconda3/lib/python3.11/site-packages/IPython/core/pylabtools.py:170: UserWarning: Glyph 21578 (\N{CJK UNIFIED IDEOGRAPH-544A}) missing from font(s) DejaVu Sans.
  fig.canvas.print_figure(bytes_io, **kw)
/Users/hiroshi/anaconda3/lib/python3.11/site-packages/IPython/core/pylabtools.py:170: UserWarning: Glyph 26082 (\N{CJK UNIFIED IDEOGRAPH-65E2}) missing from font(s) DejaVu Sans.
  fig.canvas.print_figure(bytes_io, **kw)
/Users/hiroshi/anaconda3/lib/python3.11/site-packages/IPython/core/pylabtools.py:170: UserWarning: Glyph 23384 (\N{CJK UNIFIED IDEOGRAPH-5B58}) missing from font(s) DejaVu Sans.
  fig.canvas.print_figure(bytes_io, **kw)
/Users/hiroshi/anaconda3/lib/python3.11/site-packages/IPython/core/pylabtools.py:170: UserWarning: Glyph 39015 (\N{CJK UNIFIED IDEOGRAPH-9867}) missing from font(s) DejaVu Sans.
  fig.canvas.print_figure(bytes_io, **kw)
/Users/hiroshi/anaconda3/lib/python3.11/site-packages/IPython/core/pylabtools.py:170: UserWarning: Glyph 23458 (\N{CJK UNIFIED IDEOGRAPH-5BA2}) missing from font(s) DejaVu Sans.
  fig.canvas.print_figure(bytes_io, **kw)
/Users/hiroshi/anaconda3/lib/python3.11/site-packages/IPython/core/pylabtools.py:170: UserWarning: Glyph 32057 (\N{CJK UNIFIED IDEOGRAPH-7D39}) missing from font(s) DejaVu Sans.
  fig.canvas.print_figure(bytes_io, **kw)
/Users/hiroshi/anaconda3/lib/python3.11/site-packages/IPython/core/pylabtools.py:170: UserWarning: Glyph 20171 (\N{CJK UNIFIED IDEOGRAPH-4ECB}) missing from font(s) DejaVu Sans.
  fig.canvas.print_figure(bytes_io, **kw)
Reading the results
The optimal solution is to avoid allocating the entire amount to the most efficient measures ever, but to spread out the diminishing returns. In practice, restrictions such as the number of negotiations that salespeople can handle, brand maintenance, and contracted limits are also added to the requirements. Since the coefficient is an estimate, sensitivity analysis is performed without treating the solution as absolute.
No.008: How to Face Uncertainty
Meaning in Practice
Even if the average order rate is the same, the reliability difference between 10 observations and 1,000 observations can be different. If you set your budget based solely on point estimates, you risk overestimating initiatives with limited data.
Approach to Analysis and Modeling
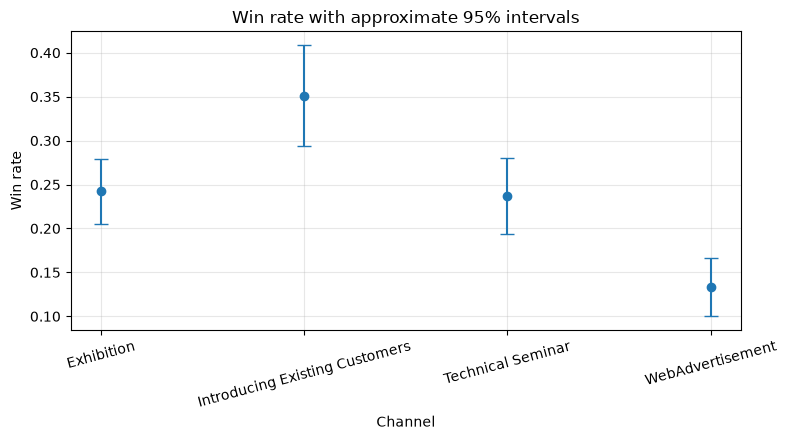
Orders are considered to be Bernoulli trials, and the standard error is
This approximates the situation. The 95% interval is set to (for small specimens, Wilson intervals are appropriate).
Check with Python
uncertainty = df.groupby("channel").agg(wins=("orders", "sum"), trials=("opportunities", "sum"))
uncertainty["rate"] = uncertainty["wins"] / uncertainty["trials"]
uncertainty["se"] = np.sqrt(uncertainty["rate"]*(1-uncertainty["rate"])/uncertainty["trials"])
uncertainty["lower95"] = (uncertainty["rate"]-1.96*uncertainty["se"]).clip(0, 1)
uncertainty["upper95"] = (uncertainty["rate"]+1.96*uncertainty["se"]).clip(0, 1)
display(uncertainty.round(3))

fig, ax = plt.subplots()
err = np.vstack([uncertainty["rate"]-uncertainty["lower95"], uncertainty["upper95"]-uncertainty["rate"]])
ax.errorbar(uncertainty.index, uncertainty["rate"], yerr=err, fmt="o", capsize=5)
ax.set_title("Win rate with approximate 95% intervals")
ax.set_xlabel("Channel"); ax.set_ylabel("Win rate")
ax.grid(True, alpha=.3); ax.tick_params(axis="x", rotation=15)
fig.tight_layout(); plt.show()| wins | trials | rate | se | lower95 | upper95 | |
|---|---|---|---|---|---|---|
| channel | ||||||
| WebAdvertisement | 54 | 405 | 0.13 | 0.02 | 0.10 | 0.17 |
| Exhibition | 123 | 508 | 0.24 | 0.02 | 0.20 | 0.28 |
| Technical Seminar | 87 | 367 | 0.24 | 0.02 | 0.19 | 0.28 |
| Introducing Existing Customers | 92 | 262 | 0.35 | 0.03 | 0.29 | 0.41 |
/var/folders/3y/fmw40k0x78xblvb3gkcyvy1h0000gn/T/ipykernel_1522/1893485025.py:14: UserWarning: Glyph 24195 (\N{CJK UNIFIED IDEOGRAPH-5E83}) missing from font(s) DejaVu Sans.
  fig.tight_layout(); plt.show()
/var/folders/3y/fmw40k0x78xblvb3gkcyvy1h0000gn/T/ipykernel_1522/1893485025.py:14: UserWarning: Glyph 21578 (\N{CJK UNIFIED IDEOGRAPH-544A}) missing from font(s) DejaVu Sans.
  fig.tight_layout(); plt.show()
/var/folders/3y/fmw40k0x78xblvb3gkcyvy1h0000gn/T/ipykernel_1522/1893485025.py:14: UserWarning: Glyph 23637 (\N{CJK UNIFIED IDEOGRAPH-5C55}) missing from font(s) DejaVu Sans.
  fig.tight_layout(); plt.show()
/var/folders/3y/fmw40k0x78xblvb3gkcyvy1h0000gn/T/ipykernel_1522/1893485025.py:14: UserWarning: Glyph 31034 (\N{CJK UNIFIED IDEOGRAPH-793A}) missing from font(s) DejaVu Sans.
  fig.tight_layout(); plt.show()
/var/folders/3y/fmw40k0x78xblvb3gkcyvy1h0000gn/T/ipykernel_1522/1893485025.py:14: UserWarning: Glyph 20250 (\N{CJK UNIFIED IDEOGRAPH-4F1A}) missing from font(s) DejaVu Sans.
  fig.tight_layout(); plt.show()
/var/folders/3y/fmw40k0x78xblvb3gkcyvy1h0000gn/T/ipykernel_1522/1893485025.py:14: UserWarning: Glyph 25216 (\N{CJK UNIFIED IDEOGRAPH-6280}) missing from font(s) DejaVu Sans.
  fig.tight_layout(); plt.show()
/var/folders/3y/fmw40k0x78xblvb3gkcyvy1h0000gn/T/ipykernel_1522/1893485025.py:14: UserWarning: Glyph 34899 (\N{CJK UNIFIED IDEOGRAPH-8853}) missing from font(s) DejaVu Sans.
  fig.tight_layout(); plt.show()
/var/folders/3y/fmw40k0x78xblvb3gkcyvy1h0000gn/T/ipykernel_1522/1893485025.py:14: UserWarning: Glyph 12475 (\N{KATAKANA LETTER SE}) missing from font(s) DejaVu Sans.
  fig.tight_layout(); plt.show()
/var/folders/3y/fmw40k0x78xblvb3gkcyvy1h0000gn/T/ipykernel_1522/1893485025.py:14: UserWarning: Glyph 12511 (\N{KATAKANA LETTER MI}) missing from font(s) DejaVu Sans.
  fig.tight_layout(); plt.show()
/var/folders/3y/fmw40k0x78xblvb3gkcyvy1h0000gn/T/ipykernel_1522/1893485025.py:14: UserWarning: Glyph 12490 (\N{KATAKANA LETTER NA}) missing from font(s) DejaVu Sans.
  fig.tight_layout(); plt.show()
/var/folders/3y/fmw40k0x78xblvb3gkcyvy1h0000gn/T/ipykernel_1522/1893485025.py:14: UserWarning: Glyph 12540 (\N{KATAKANA-HIRAGANA PROLONGED SOUND MARK}) missing from font(s) DejaVu Sans.
  fig.tight_layout(); plt.show()
/var/folders/3y/fmw40k0x78xblvb3gkcyvy1h0000gn/T/ipykernel_1522/1893485025.py:14: UserWarning: Glyph 26082 (\N{CJK UNIFIED IDEOGRAPH-65E2}) missing from font(s) DejaVu Sans.
  fig.tight_layout(); plt.show()
/var/folders/3y/fmw40k0x78xblvb3gkcyvy1h0000gn/T/ipykernel_1522/1893485025.py:14: UserWarning: Glyph 23384 (\N{CJK UNIFIED IDEOGRAPH-5B58}) missing from font(s) DejaVu Sans.
  fig.tight_layout(); plt.show()
/var/folders/3y/fmw40k0x78xblvb3gkcyvy1h0000gn/T/ipykernel_1522/1893485025.py:14: UserWarning: Glyph 39015 (\N{CJK UNIFIED IDEOGRAPH-9867}) missing from font(s) DejaVu Sans.
  fig.tight_layout(); plt.show()
/var/folders/3y/fmw40k0x78xblvb3gkcyvy1h0000gn/T/ipykernel_1522/1893485025.py:14: UserWarning: Glyph 23458 (\N{CJK UNIFIED IDEOGRAPH-5BA2}) missing from font(s) DejaVu Sans.
  fig.tight_layout(); plt.show()
/var/folders/3y/fmw40k0x78xblvb3gkcyvy1h0000gn/T/ipykernel_1522/1893485025.py:14: UserWarning: Glyph 32057 (\N{CJK UNIFIED IDEOGRAPH-7D39}) missing from font(s) DejaVu Sans.
  fig.tight_layout(); plt.show()
/var/folders/3y/fmw40k0x78xblvb3gkcyvy1h0000gn/T/ipykernel_1522/1893485025.py:14: UserWarning: Glyph 20171 (\N{CJK UNIFIED IDEOGRAPH-4ECB}) missing from font(s) DejaVu Sans.
  fig.tight_layout(); plt.show()
/Users/hiroshi/anaconda3/lib/python3.11/site-packages/IPython/core/pylabtools.py:170: UserWarning: Glyph 24195 (\N{CJK UNIFIED IDEOGRAPH-5E83}) missing from font(s) DejaVu Sans.
  fig.canvas.print_figure(bytes_io, **kw)
/Users/hiroshi/anaconda3/lib/python3.11/site-packages/IPython/core/pylabtools.py:170: UserWarning: Glyph 21578 (\N{CJK UNIFIED IDEOGRAPH-544A}) missing from font(s) DejaVu Sans.
  fig.canvas.print_figure(bytes_io, **kw)
/Users/hiroshi/anaconda3/lib/python3.11/site-packages/IPython/core/pylabtools.py:170: UserWarning: Glyph 23637 (\N{CJK UNIFIED IDEOGRAPH-5C55}) missing from font(s) DejaVu Sans.
  fig.canvas.print_figure(bytes_io, **kw)
/Users/hiroshi/anaconda3/lib/python3.11/site-packages/IPython/core/pylabtools.py:170: UserWarning: Glyph 31034 (\N{CJK UNIFIED IDEOGRAPH-793A}) missing from font(s) DejaVu Sans.
  fig.canvas.print_figure(bytes_io, **kw)
/Users/hiroshi/anaconda3/lib/python3.11/site-packages/IPython/core/pylabtools.py:170: UserWarning: Glyph 20250 (\N{CJK UNIFIED IDEOGRAPH-4F1A}) missing from font(s) DejaVu Sans.
  fig.canvas.print_figure(bytes_io, **kw)
/Users/hiroshi/anaconda3/lib/python3.11/site-packages/IPython/core/pylabtools.py:170: UserWarning: Glyph 25216 (\N{CJK UNIFIED IDEOGRAPH-6280}) missing from font(s) DejaVu Sans.
  fig.canvas.print_figure(bytes_io, **kw)
/Users/hiroshi/anaconda3/lib/python3.11/site-packages/IPython/core/pylabtools.py:170: UserWarning: Glyph 34899 (\N{CJK UNIFIED IDEOGRAPH-8853}) missing from font(s) DejaVu Sans.
  fig.canvas.print_figure(bytes_io, **kw)
/Users/hiroshi/anaconda3/lib/python3.11/site-packages/IPython/core/pylabtools.py:170: UserWarning: Glyph 12475 (\N{KATAKANA LETTER SE}) missing from font(s) DejaVu Sans.
  fig.canvas.print_figure(bytes_io, **kw)
/Users/hiroshi/anaconda3/lib/python3.11/site-packages/IPython/core/pylabtools.py:170: UserWarning: Glyph 12511 (\N{KATAKANA LETTER MI}) missing from font(s) DejaVu Sans.
  fig.canvas.print_figure(bytes_io, **kw)
/Users/hiroshi/anaconda3/lib/python3.11/site-packages/IPython/core/pylabtools.py:170: UserWarning: Glyph 12490 (\N{KATAKANA LETTER NA}) missing from font(s) DejaVu Sans.
  fig.canvas.print_figure(bytes_io, **kw)
/Users/hiroshi/anaconda3/lib/python3.11/site-packages/IPython/core/pylabtools.py:170: UserWarning: Glyph 12540 (\N{KATAKANA-HIRAGANA PROLONGED SOUND MARK}) missing from font(s) DejaVu Sans.
  fig.canvas.print_figure(bytes_io, **kw)
/Users/hiroshi/anaconda3/lib/python3.11/site-packages/IPython/core/pylabtools.py:170: UserWarning: Glyph 26082 (\N{CJK UNIFIED IDEOGRAPH-65E2}) missing from font(s) DejaVu Sans.
  fig.canvas.print_figure(bytes_io, **kw)
/Users/hiroshi/anaconda3/lib/python3.11/site-packages/IPython/core/pylabtools.py:170: UserWarning: Glyph 23384 (\N{CJK UNIFIED IDEOGRAPH-5B58}) missing from font(s) DejaVu Sans.
  fig.canvas.print_figure(bytes_io, **kw)
/Users/hiroshi/anaconda3/lib/python3.11/site-packages/IPython/core/pylabtools.py:170: UserWarning: Glyph 39015 (\N{CJK UNIFIED IDEOGRAPH-9867}) missing from font(s) DejaVu Sans.
  fig.canvas.print_figure(bytes_io, **kw)
/Users/hiroshi/anaconda3/lib/python3.11/site-packages/IPython/core/pylabtools.py:170: UserWarning: Glyph 23458 (\N{CJK UNIFIED IDEOGRAPH-5BA2}) missing from font(s) DejaVu Sans.
  fig.canvas.print_figure(bytes_io, **kw)
/Users/hiroshi/anaconda3/lib/python3.11/site-packages/IPython/core/pylabtools.py:170: UserWarning: Glyph 32057 (\N{CJK UNIFIED IDEOGRAPH-7D39}) missing from font(s) DejaVu Sans.
  fig.canvas.print_figure(bytes_io, **kw)
/Users/hiroshi/anaconda3/lib/python3.11/site-packages/IPython/core/pylabtools.py:170: UserWarning: Glyph 20171 (\N{CJK UNIFIED IDEOGRAPH-4ECB}) missing from font(s) DejaVu Sans.
  fig.canvas.print_figure(bytes_io, **kw)
Reading the results
We should not definitively talk about small ranking differences in channels where the intervals overlap. It is reasonable to set a training budget for new initiatives and redistribute data after accumulating data. Depending on risk tolerance, some judges prioritize the lower boundary of the range over expected values.
No.009: The Role of Simulation
Meaning in Practice
A business plan requires not only “how much sales are worth,” but also “what the probability of losses is” and “how far it could drop in bad cases.” Simulations combine multiple uncertainties and present the results as a distribution.
Approach to Analysis and Modeling
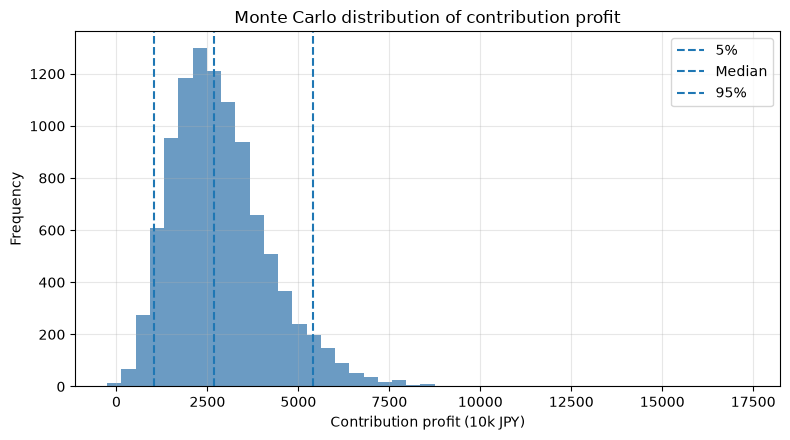
We use the Monte Carlo method, which represents the number of deals with the Poisson distribution, the number of orders as the binomial distribution, and the unit price of the deal as the log-normal distribution. Distribution assumptions are verified using historical data and business knowledge.
Check with Python
sim_rng = np.random.default_rng(42)
n_sim = 10_000
sim_opportunities = sim_rng.poisson(55, n_sim)
sim_orders = sim_rng.binomial(sim_opportunities, 0.24)
sim_prices = sim_rng.lognormal(np.log(720), 0.25, n_sim)
sim_profit = sim_orders * sim_prices * 0.36 - 650
q = np.quantile(sim_profit, [0.05, 0.50, 0.95])
print(f"5%point: {q[0]:,.0f} ten_thousand_yen / median: {q[1]:,.0f} ten_thousand_yen / 95%point: {q[2]:,.0f} ten_thousand_yen")
print(f"deficit probability: {(sim_profit < 0).mean():.2%}")

fig, ax = plt.subplots()
ax.hist(sim_profit, bins=45, color="steelblue", alpha=.8)
for value, label in zip(q, ["5%", "Median", "95%"]):
    ax.axvline(value, linestyle="--", label=label)
ax.set_title("Monte Carlo distribution of contribution profit")
ax.set_xlabel("Contribution profit (10k JPY)"); ax.set_ylabel("Frequency")
ax.grid(True, alpha=.3); ax.legend(); fig.tight_layout(); plt.show()
5% point: 10.44 million yen / Median: 26.83 million yen / 95% point: 54.04 million yen
Probability of deficit: 0.04%
Reading the results
By showing not only the median but also a 5% point and a probability of loss, contingency funds and withdrawal conditions can be decided in advance. Simulation is not a device for predicting the future, but rather a device that visualizes risks if assumptions are true.
No.010: Building a Python Environment
Meaning in Practice
If analysis only runs on the person in charge’s PC, it will not become established as a decision-making process. Record and reproduce the environment, dependency libraries, random numbers, data definitions, and execution order.
Approach to Analysis and Modeling
The Notebook is suitable for exploration and explanation. On the other hand, production operations require data validation, functionalization, testing, version control, and regular execution. The minimum condition is that cells can be redone in order from the top.
Check with Python
environment = pd.DataFrame({
    "item": ["Python", "NumPy", "pandas", "matplotlib", "random seed", "external data"],
    "value": [sys.version.split()[0], np.__version__, pd.__version__, matplotlib.__version__, "42", "None"]
})
display(environment)
assert len(df) == 24 * 4
assert df[["spend", "leads", "orders", "revenue"]].notna().all().all()
assert (df[["spend", "leads", "orders", "revenue"]] >= 0).all().all()
print("Data Quality Check: OK")| item | value | |
|---|---|---|
| 0 | Python | 3.11.9 |
| 1 | NumPy | 1.26.4 |
| 2 | pandas | 2.2.2 |
| 3 | matplotlib | 3.9.2 |
| 4 | random seed | 42 |
| 5 | external data | None |
Data Quality Check: OKReading the results
The version and seed were clearly displayed, and the quality check was passed. In practice, dependencies are locked and the original data update date, column definitions, handling of personal information, and approval history are recorded.
Practical Implications Seen Through Target Exercise
What all 10 have in common is that Designing Decisions comes before the amount of data. Break down KGI into funnel KPIs, convert probabilities and amounts into expected value, suspect confounding, allocate under constraints, and report uncertainty as a breadth. This shifts the meeting focus from “which numbers are correct” to “which assumptions and which actions to choose.”
What is necessary for practical implementation
- Defining management challenges and decision frequency
- Connecting customers, projects, initiatives, and orders with a common ID
- Turning KPI formulas, responsible persons, and update frequency into a data dictionary
- Decide on control groups, duration, success criteria, and withdrawal conditions before implementing measures
- Evaluate not only model accuracy but also gross profit, man-hours, and risk
- Review assumptions and results monthly and redistribute them in small segments.
Conclusion
Marketing science is not about using complex methods, but about making questions measurable, creating comparable options, and learning from the results. In this notebook, we examined the process of making decisions through hypothetical data from manufacturing B2B to aggregation, KPIs, models, causality, optimization, uncertainty, and simulation.
Consultations for Corporations
At Suri Kobo, we support everything from problem organization to analysis, implementation, and human resource development in the manufacturing industry, covering marketing KPI design, customer and project data infrastructure, demand forecasting, measure effectiveness verification, and budget allocation optimization. Even when data is not yet fully prepared, you can consult us starting with decision-making and organizing collection design.
📩 Contact Us: surikobo.co.jp/contact
Please feel free to consult us first.